- About
- Browse Articles
-
Special Issues
- Pioneering strategies for overcoming bacterial drug resistance (2026)
- Advancing microbial engineering through synthetic biology (2025)
- Host-associated microbiome (2024)
- Bacterial regulatory mechanisms for the control of complex cellular mechanisms (2023)
- Two years into COVID-19 pandemic: Where are we? (2022)
- Collections
- For Contributors
- Policies
- E-Submission

- About
- Browse Articles
-
Special Issues
- Pioneering strategies for overcoming bacterial drug resistance (2026)
- Advancing microbial engineering through synthetic biology (2025)
- Host-associated microbiome (2024)
- Bacterial regulatory mechanisms for the control of complex cellular mechanisms (2023)
- Two years into COVID-19 pandemic: Where are we? (2022)
- Collections
- Policies
- For Contributors
Articles
- Page Path
- HOME > J. Microbiol > Volume 63(1); 2025 > Review
-
Minireview
A review on computational models for predicting protein solubility - Teerapat Pimtawong†, Jun Ren†, Jingyu Lee, Hyang-Mi Lee, Dokyun Na
-
Journal of Microbiology 2025;63(1):e.2408001.
DOI: https://doi.org/10.71150/jm.2408001
Published online: January 24, 2025
Department of Biomedical Engineering, Chung-Ang University, Seoul 06974, Republic of Korea
- Correspondence. Hyang-Mi Lee: myhys84@cau.ac.kr ; Dokyun Na: blisszen@cau.ac.kr
- †These authors contributed equally to this work.
© The Microbiological Society of Korea
This is an Open Access article distributed under the terms of the Creative Commons Attribution Non-Commercial License (http://creativecommons.org/licenses/by-nc/4.0) which permits unrestricted non-commercial use, distribution, and reproduction in any medium, provided the original work is properly cited.
- ABSTRACT
- Introduction
- Computational Models for Protein Solubility Prediction
- Datasets for Model Development
- Features and Feature Calculation Tools
- Overview of Computation Models, Algorithms, and Features for Protein Solubility Prediction
- Challenges in the Development of Protein Solubility Prediction Models
- Conclusion
- Notes
- References
ABSTRACT
- Protein solubility is a critical factor in the production of recombinant proteins, which are widely used in various industries, including pharmaceuticals, diagnostics, and biotechnology. Predicting protein solubility remains a challenging task due to the complexity of protein structures and the multitude of factors influencing solubility. Recent advances in computational methods, particularly those based on machine learning, have provided powerful tools for predicting protein solubility, thereby reducing the need for extensive experimental trials. This review provides an overview of current computational approaches to predict protein solubility. We discuss the datasets, features, and algorithms employed in these models. The review aims to bridge the gap between computational predictions and experimental validations, fostering the development of more accurate and reliable solubility prediction models that can significantly enhance recombinant protein production.
Introduction
Computational Models for Protein Solubility Prediction
Datasets for Model Development
Features and Feature Calculation Tools
Overview of Computation Models, Algorithms, and Features for Protein Solubility Prediction
Challenges in the Development of Protein Solubility Prediction Models
Conclusion
Acknowledgments
This work was supported by the National Research Foundation of Korea (NRF) grant funded by the Korea government (MSIT) (NRF-2022M3A9B6082687 and NRF-2023R1A2C1008156) and was also supported by the Chung-Ang University Young Scientist Scholarship in 2021.
Conflict of Interest
The authors declare that they have no conflict of interest.
Schematic illustration depicting the general workflow of machine learning-based approaches for predicting protein solubility.

| Model | Dataset (soluble + insoluble) | Machine learning algorithm | Features | Performances | Pros | Cons | References | |
|---|---|---|---|---|---|---|---|---|
| Classification models | PROSO | E. coli | Chained models of SVM and naïve Bayes | Amino acid compositions and alpha-helical structure composition | Crossvalidation: | Computationally efficient, simple to use | Lacks structural data, limited in complex solubility cases | Smialowski et al. (2007) |
| > 14,000 | Accuracy: 0.72 | |||||||
| (50% and 50%)1) | AUC: 0.78 | |||||||
| Model is not available to access | ||||||||
| SOLpro | E. coli | Chained 20 SVM models with 1 SVM output model | Compositions (amino acids, dipeptides, and tripeptides), physicochemical properties (hydropathy, charge, molecular weight, aliphatic index, etc.), secondary structure composition, exposed residues, number of domains, etc. | Crossvalidation: | Advanced SVM-based architecture, better accuracy | Constrained by sequence-only features, no structural insight | Magnan et al. (2009) | |
| 17408 | Accuracy: 0.74 | |||||||
| (8,704+8,704) | AUC: 0.74 | |||||||
| Web-based tool is available at https://scratch.proteomics.ics.uci.edu/ | ||||||||
| PROSO II | E. coli | Chained model: two input models of Parzen window model and logistic regression classifier, and an output model of logistic regression classifier | Compositions (amino acids, dipeptides, and tripeptides), physicochemical properties (isoelectric point, GRAVY index, etc.), secondary structures, exposed residues, and number of domains | Independent test: | Improved with larger datasets and refined algorithms | No structural data, reduced accuracy for complex proteins | Smialowski et al. (2012) | |
| 82,2992) | Accuracy: 0.75 | |||||||
| for training | ||||||||
| 1765 | ||||||||
| (⅙ + ⅚)1) | ||||||||
| hold-out for test | ||||||||
| Model is not available to access | ||||||||
| PaRSnIP | E. coli | Gradient boosting machine | Compositions (amino acids, dipeptides, and tripeptidmagnes), sequence length, molecular weight, fraction of turn-forming residues, average hydropathicity, aliphatic index, absolute charge, secondary structures, hydrophobicity of exposed residues. | Independent test: | Effective use of GBM for feature handling | Relies on manual feature selection, no structural data | Rawi et al. (2018) | |
| 69420 | Accuracy: 0.74 | |||||||
| (28,972+40,448) for training | MCC: 0.48 | |||||||
| 2001 | ||||||||
| (1,000+1,001)3) for testing | ||||||||
| Source codes are available at https://github.com/RedaRawi/PaRSnIP | ||||||||
| DeepSol | E. coli | Convolutional neural network | Amino acid compositions, molecular weight, absolute charge, aliphatic index, average hydropathicity (GRAVY), fraction of turn-forming residues, secondary structures, fraction of exposed residues, and hydrophobicity of exposed residues. | Independent test: | Automated feature learning with higher accuracy | Lacks structural data, limited for complex proteins | Khurana et al. (2018) | |
| 69420 | Accuracy: 0.77 | |||||||
| (28,972+40,448) for training | MCC4): 0.55 | |||||||
| 2001 | ||||||||
| (1,000+1,001)3) for testing | ||||||||
| Source codes are available at https://zenodo.org/records/1162886 | ||||||||
| SoluProt | E. coli | Gradient boosting machine | Compositions (amino acids and dipeptides), physicochemical properties, average flexibility, secondary structure content, average disorder, residue content in transmembrane helices, maximum identity to E. coli proteins in PDB | Independent test: | Robust handling of noisy data, effective feature selection | Lower accuracy and MCC, less suited for high-precision tasks | Hon et al. (2021) | |
| 11436 | Accuracy: 0.59 | |||||||
| (5,718+5,718) for training | MCC: 0.17 | |||||||
| 3100 | ||||||||
| (1,550+1,550) for testing | ||||||||
| Web-based tool and datasets are available at https://loschmidt.chemi.muni.cz/soluprot/ | ||||||||
| NetSolP | E. coli | Two input models, ESM1b and ProtT5 transformer-based models, with an output passed to a classification layer | Sequence embeddings (from transformer models like ESM1b and ProtT5), sequence profiles (MSAs generated using HHblits), and amino acid conservation (calculated using conservation scores). | Independent test: | Transformer-based model captures complex sequence-residue interactions | Moderate accuracy and MCC, computationally demanding | Thumuluri et al. (2022) | |
| 12216 | Accuracy: 0.76 | |||||||
| (66% + 34%)1) for training | MCC: 0.40 | |||||||
| 1323 | ||||||||
| (620+703) for testing | ||||||||
| Source codes are available at https://github.com/TviNet/NetSolP-1.0 | ||||||||
| PROTSOLM | E. coli | Multi-modal model: two input models, ESM2 for protein sequence embedding and equivariant graph neural networks (EGNNs) for structural feature encoding, combined with an output model of a deep learning classifier. Gradient boosting machine | Sequence embeddings (ESM2-650M), inter-residue distances, backbone geometry, physicochemical properties (charged residues, GRAVY index, and turn-forming residues), secondary structure content, solvent accessibility, hydrogen bond density, hydrophobicity of exposed residues, and structure confidence (pLDDT from ESMFold). | Independent test: | Multimodal approach integrates sequence and structure data | Dependence on structural data may limit broad applicability | Tan et al. (2024) | |
| 64598 | Accuracy: 0.79 | |||||||
| (33,763+30,835) for training | MCC: 0.58 | |||||||
| 3230 | Independent test: | |||||||
| (1,675+1,555) for testing | Accuracy: 0.60 | |||||||
| MCC: 0.22 | ||||||||
| 2155 | Independent test: | |||||||
| (951+1,204)6) for testing | Accuracy: 0.60 | |||||||
| MCC: 0.23 | ||||||||
| 1784 | ||||||||
| (1,052+732)6) for testing | ||||||||
| 3640 | Independent test: | |||||||
| (1,817+1,823)6) for testing | Accuracy: 0.60 | |||||||
| MCC: 0.21 | ||||||||
| Source codes are available at https://github.com/tyang816/ProtSolM | ||||||||
| PLM_Sol | E. coli | Two input embedding models, ProtT5 and ESM2, are combined with an output model of biLSTM_TextCNN layer | Protein sequence embeddings (capturing contextual information such as residue-level interactions and sequence structure). | Independent test: | Leverages PLMs for richer contextual embeddings | Computationally intensive, dependent on large datasets | Zhang et al. (2024) | |
| 79344 | Accuracy: 0.72 | |||||||
| (47,291+32,053) for training | MCC: 0.46 | |||||||
| 4000 | ||||||||
| (2,000+2,000) for testing | ||||||||
| Source codes are available at https://zenodo.org/records/12881509 | ||||||||
| DeepSoluE | E. coli | Long Short-Term Memory network | Physicochemical properties (isoelectric point, aromaticity, molecular weight, flexibility, and instability index), sequence embedding, and secondary structure content, along with structural-based features (protein sequence length, residue-level solvent accessibility, and torsion angle domain). | Independent test: | Balanced approach, integrates physicochemical features | Moderate accuracy and MCC, less suited for high-precision tasks | Wang & Zou (2023) | |
| 11436 | Accuracy: 0.59 | |||||||
| (5,718+ 5,718) for training | MCC: 0.18 | |||||||
| 3100 | ||||||||
| (1,550+1,550) for testing | ||||||||
| Web-based tool and datasets are available at http://lab.malab.cn/~wangchao/softs/DeepSoluE/ | ||||||||
| Regression models | SOLart | E. coli | Random forest | Compositions of amino acids, secondary structure content, protein length, protein solvent accessibility, and statistical potentials (residue-level solvent accessibility and torsion angle domain). | Independent tests: | Accurate for quantitative solubility predictions, strong cross-species performance | Limited by dependence on 3D structural data | Hou et al. (2020) |
| 4065) for training | on E. coli | |||||||
| R2: 0.448 | ||||||||
| E. coli | RMSE: 23% | |||||||
| 5505) for testing | on S. cerevisiae | |||||||
| R2: 0.608, 0.490 | ||||||||
| S. cerevisiae | RMSE: 23%, 20% | |||||||
| 59 and 505) for testing | ||||||||
| Web-based tool is available at http://babylone.ulb.ac.be/SOLART | ||||||||
| SVR Model | E. coli | Support Vector Regression | Compositions of amino acids | Independent tests: | Efficient solubility optimization, successful experimental validation and versatile applicability | No internal test dataset and limited consideration of stability | Han et al. (2020) | |
| 3,1485) for training | on E. coli | |||||||
| R2: 0.57 | ||||||||
| 4 proteins5) | ||||||||
| for experimental validation | ||||||||
| Source codes are available at https://github.com/KangZhouGroupNUS/optimization_protein-solubility | ||||||||
| GraphSol | E. coli | Graph convolutional network | Hidden Markov model, PSSM, diverse physicochemical properties (steric parameters, hydrophobicity, volume, polarizability, isoelectric point, etc.), relative solvent accessible surface area, backbone torsion angles, protein contact map, etc. | Independent tests: | Strong integration of sequence and structure | Dependent on structural data, limiting generalizability | Chen et al. (2021) | |
| 20525) for training | on E. coli | |||||||
| R2: 0.48 | ||||||||
| E. coli | on S. cerevisiae | |||||||
| 6855) for testing | R2: 0.37 | |||||||
| S. cerevisiae | ||||||||
| 1085) for testing | ||||||||
| Source codes are available at https://github.com/jcchan23/GraphSol | ||||||||
1) Only percentages or ratios have been reported.
2) The ratio of soluble and insoluble data has not been reported.
3) External qualitative solubility dataset from the study of Chang et al. (2014).
4) Mathew’s correlation coefficient (MCC), a balanced accuracy for imbalanced dataset.
5) Quantitative solubility datasets for regression model training and testing.
6) External qualitative solubility dataset from literature of Tan et al., Niwa et al., and Smialowski et al., respectively (Niwa et al., 2009; Smialowski et al., 2012; Tan et al., 2024).
| Tool name | Number of features | Feature | URL | References |
|---|---|---|---|---|
| PROFEAT | < 2,000 | Residue compositions, physicochemical properties, sequence order and secondary structures, topological characteristics, interaction patterns, and other network properties | http://bidd2.nus.edu.sg/cgi-bin/profeat2016/main.cgi* | Zhang et al. (2017) |
| iFeatureOmega | > 18,000 | Residue compositions, physicochemical properties, sequence order and secondary structures, half sphere exposure, residue depth, atom composition and network-based index | https://github.com/Superzchen/iFeatureOmega-CLI | Chen et al. (2022) |
| protr | 22700 | Residue compositions, physicochemical properties, secondary structure, similarity score, customizable descriptors (AAindex database), Auxiliary functions | https://github.com/nanxstats/protr | Xiao et al. (2015) |
| Rcpi | > 10,000 | Residue composition, physicochemical properties, secondary structures, PSSM profile, PCM, GO similarity, sequence similarity. Rcpi also provides compound-related features and protein-compound/protein-protein interactions features | https://github.com/nanxstats/Rcpi | Cao et al. (2015) |
| Propy | 9547 | Residue compositions, physicochemical properties, sequence order coupling numbers, pseudo amino acids compositions. | https://github.com/MartinThoma/propy3 | Cao et al. (2013) |
| PDBparam | > 50 | Physicochemical properties, secondary structures, inter-residue interactions, identification of binding sites from PDB structure | https://www.iitm.ac.in/bioinfo/pdbparam/index.html | Nagarajan et al. (2016) |
| POSSUM | 12010 | PSSM-based features | https://possum.erc.monash.edu/ | Wang et al. (2017) |
| Pfeature | 200,000+ | Diverse sequence-based features, binary profiles, evolutionary information based on PSSM, structural features, and pattern-based features | https://github.com/raghavagps/Pfeature | Pande et al. (2023) |
- Aer L, Jiang Q, Zhong L, Si Q, Liu X, et al. 2024. Optimization of polyethylene terephthalate biodegradation using a self-assembled multi-enzyme cascade strategy. J Hazard Mater. 476: 134887.ArticlePubMed
- Aguirre-Plans J, Meseguer A, Molina-Fernandez R, Marin-Lopez MA, Jumde G, et al. 2021. SPServer: split-statistical potentials for the analysis of protein structures and protein-protein interactions. BMC Bioinform. 22(1): 4.ArticlePubMedPMCPDF
- Arendt P, Pollier J, Callewaert N, Goossens A. 2016. Synthetic biology for production of natural and new-to-nature terpenoids in photosynthetic organisms. Plant J. 87(1): 16–37. ArticlePubMed
- Berman HM, Gabanyi MJ, Kouranov A, Micallef D, Westbrook JJZd. 2017. Protein structure initiative–targettrack 2000-2017–all data files, p. 10, Zenodo.. Article
- Bhandari BK, Lim CS, Gardner PP. 2021. TISIGNER.com: web services for improving recombinant protein production. Nucleic Acids Res. 49(W1): W654–W661. ArticlePubMedPMCPDF
- Bhatwa A, Wang WJ, Hassan YI, Abraham N, Li XZ, et al. 2021. Challenges associated with the formation of recombinant protein inclusion bodies in and strategies to address them for industrial applications. Front Bioeng Biotechnol. 9: 630551.ArticlePubMedPMC
- Burley SK, Berman HM, Bhikadiya C, Bi C, Chen L, et al. 2019. Protein Data Bank: the single global archive for 3D macromolecular structure data. Nucleic Acids Res. 47(D1): D520–D528. PubMed
- Bystroff C, Krogh A. 2008. Hidden Markov models for prediction of protein features. Methods Mol Biol. 413: 173–198. ArticlePubMed
- Cao DS, Xiao N, Xu QS, Chen AF. 2015. Rcpi: R/Bioconductor package to generate various descriptors of proteins, compounds and their interactions. Bioinformatics. 31(2): 279–281. ArticlePubMedPDF
- Cao DS, Xu QS, Liang YZ. 2013. Propy: a tool to generate various modes of Chou's PseAAC. Bioinformatics. 29(7): 960–962. ArticlePubMedPDF
- Chang CCH, Song JN, Tey BT, Ramanan RN. 2015. Bioinformatics approaches for improved recombinant protein production in protein solubility prediction. Brief Bioinform. 15(6): 953–962. ArticlePubMed
- Chen JW, Zheng SJ, Zhao HY, Yang YD. 2021. Structure-aware protein solubility prediction from sequence through graph convolutional network and predicted contact map. J Cheminform. 13(1): 7.ArticlePubMedPMCPDF
- Chen Z, Liu XH, Zhao P, Li C, Wang YA, et al. 2022. iFeatureOmega: an integrative platform for engineering, visualization and analysis of features from molecular sequences, structural and ligand data sets. Nucleic Acids Res. 50(W1): W434–W447. ArticlePubMedPMCPDF
- Cui Y, Chen X, Wang Z, Lu Y. 2022. Cell-free PURE system: evolution and achievements. Biodes Res. 2022: 9847014.ArticlePubMedPMCPDF
- De Cesco S, Davis JB, Brennan PE. 2020. TargetDB: a target information aggregation tool and tractability predictor. Plos One. 15(9): e0232644.ArticlePubMedPMC
- de Marco A, Deuerling E, Mogk A, Tomoyasu T, Bukau B. 2007. Chaperone-based procedure to increase yields of soluble recombinant proteins produced in E. coli. BMC Biotechnol. 7: 32.ArticlePubMedPMC
- De Simone A, Dhulesia A, Soldi G, Vendruscolo M, Hsu S, et al. 2011. Experimental free energy surfaces reveal the mechanisms of maintenance of protein solubility. PNAS. 108(52): 21057–21062. ArticlePubMedPMC
- Delaney JS. 2004. ESOL: estimating aqueous solubility directly from molecular structure. J Chem Inf Model. 44(3): 1000–1005. ArticlePubMed
- Demain AL, Vaishnav P. 2009. Production of recombinant proteins by microbes and higher organisms. Biotechnol Adv. 27(3): 297–306. ArticlePubMed
- Doerr A, Foschepoth D, Forster AC, Danelon C. 2021. In vitro synthesis of 32 translation-factor proteins from a single template reveals impaired ribosomal processivity. Sci Rep-Uk. 11(1): 1898.ArticlePubMedPMCPDF
- Durham E, Dorr B, Woetzel N, Staritzbichler R, Meiler J. 2009. Solvent accessible surface area approximations for rapid and accurate protein structure prediction. J Mol Model. 15(9): 1093–1108. ArticlePubMedPMC
- Esposito D, Chatterjee DK. 2006. Enhancement of soluble protein expression through the use of fusion tags. Curr Opin Biotechnol. 17(4): 353–358. ArticlePubMed
- Fang Y, Fang J. 2013. Discrimination of soluble and aggregation-prone proteins based on sequence information. Mol Biosyst. 9(4): 806–811. ArticlePubMedPMC
- Ghosh S, Rasheedi S, Rahim SS, Banerjee S, Choudhary RK, et al. 2004. Method for enhancing solubility of the expressed recombinant proteins in Escherichia coli. Biotechniques. 37(3): 418–423. ArticlePubMed
- Godawat R, Konstantinov K, Rohani M, Warikoo V. 2015. End-to-end integrated fully continuous production of recombinant monoclonal antibodies. J Biotechnol. 213: 13–19. ArticlePubMed
- Gopal GJ, Kumar A. 2013. Strategies for the production of recombinant protein in Escherichia coli. Protein J. 32(6): 419–425. ArticlePubMedPDF
- Grossmann L, McClements DJ. 2023. Current insights into protein solubility: a review of its importance for alternative proteins. Food Hydrocoll. 137: 108416.Article
- Gutierrez-Gonzalez M, Farias C, Tello S, Perez-Etcheverry D, Romero A, et al. 2019. Optimization of culture conditions for the expression of three different insoluble proteins in Escherichia coli. Sci Rep. 9(1): 16850.ArticlePubMedPMC
- Habibi N, Hashim SZM, Norouzi A, Samian MR. 2014. A review of machine learning methods to predict the solubility of overexpressed recombinant proteins in Escherichia coli. BMC Bioinformatics. 15: 134.ArticlePubMedPMCPDF
- Han X, Ning WB, Ma XQ, Wang XN, Zhou K. 2020. Improving protein solubility and activity by introducing small peptide tags designed with machine learning models. Metab Eng Commun. 11: e00138.ArticlePubMedPMC
- Han X, Wang X, Zhou K. 2019. Develop machine learning-based regression predictive models for engineering protein solubility. Bioinformatics. 35(22): 4640–4646. ArticlePubMedPDF
- Hon J, Marusiak M, Martinek T, Kunka A, Zendulka J, et al. 2021. SoluProt: prediction of soluble protein expression in Escherichia coli. Bioinformatics. 37(1): 23–28. ArticlePubMedPMCPDF
- Hou Q, Kwasigroch JM, Rooman M, Pucci F. 2020. SOLart: a structure-based method to predict protein solubility and aggregation. Bioinformatics. 36(5): 1445–1452. ArticlePubMedPDF
- Hou Q, Waury K, Gogishvili D, Feenstra KA. 2022. Ten quick tips for sequence-based prediction of protein properties using machine learning. Plos Comput Biol. 18(12): e1010669.ArticlePubMedPMC
- Idicula-Thomas S, Balaji PV. 2005. Understanding the relationship between the primary structure of proteins and its propensity to be soluble on overexpression in Escherichia coli. Protein Sci. 14(3): 582–592. ArticlePubMedPMC
- Jumper J, Evans R, Pritzel A, Green T, Figurnov M, et al. 2021. Highly accurate protein structure prediction with AlphaFold. Nature. 596(7873): 583–589. ArticlePubMedPMCPDF
- Khurana S, Rawi R, Kunji K, Chuang GY, Bensmail H, et al. 2018. DeepSol: a deep learning framework for sequence-based protein solubility prediction. Bioinformatics. 34(15): 2605–2613. ArticlePubMedPMCPDF
- Kotronoulas G, Miguel S, Dowling M, Fernandez-Ortega P, Colomer-Lahiguera S, et al. 2023. An overview of the fundamentals of data management, analysis, and interpretation in quantitative research. Semin Oncol Nurs. 39(2): 151398.ArticlePubMed
- Kouranov A, Xie L, de la Cruz J, Chen L, Westbrook J, et al. 2006. The RCSB PDB information portal for structural genomics. Nucleic Acids Res. 34(Database issue): D302–D305. ArticlePubMedPMC
- Kuhlman B, Bradley P. 2019. Advances in protein structure prediction and design. Nat Rev Mol Cell Biol. 20(11): 681–697. ArticlePubMedPMCPDF
- LaVallie ER, Lu ZJ, Diblasio-Smith EA, Collins-Racie LA, McCoy JM. 2000. Thioredoxin as a fusion partner for production of soluble recombinant proteins in Escherichia coli. Method Enzymol. 326: 322–340. ArticlePubMed
- Liu S, Wu K, Chen C. 2022. Obtaining protein foldability information from computational models of AlphaFold2 and RoseTTAFold. Comput Struct Biotechnol J. 20: 4481–4489. ArticlePubMedPMC
- Magnan CN, Randall A, Baldi P. 2009. SOLpro: accurate sequence-based prediction of protein solubility. Bioinformatics. 25(17): 2200–2207. ArticlePubMedPDF
- Morales-Alvarez ED, Rivera-Hoyos CM, Baena-Moncada AM, Landázuri P, Poutou-Piñales RA, et al. 2013. Low-scale expression and purification of an active putative iduronate 2-sulfate sulfatase-like enzyme from Escherichia coli K1. J Microbiol. 51(2): 213–221. ArticlePubMedPDF
- Nagarajan R, Archana A, Thangakani AM, Jemimah S, Velmurugan D, et al. 2016. PDBparam: online resource for computing structural parameters of proteins. Bioinform Biol Insights. 10: 73–80. ArticlePubMedPMCLink
- Nallamsetty S, Waugh DS. 2007. Mutations that alter the equilibrium between open and closed conformations of maltose-binding protein impede its ability to enhance the solubility of passenger proteins. Biochem Biophys Res Commun. 364(3): 639–644. ArticlePubMedPMC
- Niwa T, Kanamori T, Ueda T, Taguchi H. 2012. Global analysis of chaperone effects using a reconstituted cell-free translation system. PNAS. 109(23): 8937–8942. ArticlePubMedPMC
- Niwa T, Ying BW, Saito K, Jin W, Takada S, et al. 2009. Bimodal protein solubility distribution revealed by an aggregation analysis of the entire ensemble of Escherichia coli proteins. PNAS. 106(11): 4201–4206. ArticlePubMedPMC
- Pak MA, Markhieva KA, Novikova MS, Petrov DS, Vorobyev IS, et al. 2023. Using AlphaFold to predict the impact of single mutations on protein stability and function. Plos One. 18(3): e0282689.ArticlePubMedPMC
- Pande A, Patiyal S, Lathwal A, Arora C, Kaur D, et al. 2023. Pfeature: a tool for computing wide range of protein features and building prediction models. J Comput Biol. 30(2): 204–222. ArticlePubMed
- Price WN, Handelman SK, Everett JK, Tong SN, Bracic A, et al. 2011. Large-scale experimental studies show unexpected amino acid effects on protein expression and solubility in vivo in E. coli. Microb Inform Exp. 1: 1–20. ArticlePubMedPMCPDF
- Rawi R, Mall R, Kunji K, Shen CH, Kwong PD, et al. 2018. PaRSnIP: sequence-based protein solubility prediction using gradient boosting machine. Bioinformatics. 34(7): 1092–1098. ArticlePubMedPMCPDF
- Ren J, Hwang S, Shen J, Kim H, Kim H, et al. 2022. Enhancement of the solubility of recombinant proteins by fusion with a short-disordered peptide. J Microbiol. 60(9): 960–967. ArticlePubMedPDF
- Ruff KM, Pappu RV. 2021. AlphaFold and implications for intrinsically disordered proteins. J Mol Biol. 433(20): 167208.ArticlePubMed
- Saitoh H, Uwada J, Azusa K. 2009. Strategies for the expression of SUMO-modified target proteins in Escherichia coli. Methods Mol Biol. 497: 211–221. ArticlePubMed
- Samak T, Gunter D, Wang Z. 2012. Prediction of protein solubility in E. coli, pp. 1-8, IEEE 8th International Conference on E-Science, Chicago, IL, USA.Link
- Schwede T, Kopp J, Guex N, Peitsch MC. 2003. SWISS-MODEL: an automated protein homology-modeling server. Nucleic Acids Res. 31(13): 3381–3385. ArticlePubMedPMC
- Singh V, Chaudhary DK, Mani I, Jain R, Mishra BN. 2013. Development of diagnostic and vaccine markers through cloning, expression, and regulation of putative virulence-protein-encoding genes of. J Microbiol. 51(3): 275–282. ArticlePubMedPDF
- Smialowski P, Doose G, Torkler P, Kaufmann S, Frishman D. 2012. PROSO II--a new method for protein solubility prediction. FEBS J. 279(12): 2192–2200. ArticlePubMed
- Smialowski P, Martin-Galiano AJ, Mikolajka A, Girschick T, Holak TA, et al. 2007. Protein solubility: sequence based prediction and experimental verification. Bioinformatics. 23(19): 2536–2542. ArticlePubMedPDF
- Sormanni P, Aprile FA, Vendruscolo M. 2015. The CamSol method of rational design of protein mutants with enhanced solubility. J Mol Biol. 427(2): 478–490. ArticlePubMed
- Sun Z, Liu Q, Qu G, Feng Y, Reetz MT. 2019. Utility of B-Factors in protein science: interpreting rigidity, flexibility, and internal motion and engineering thermostability. Chem Rev. 119(3): 1626–1665. ArticlePubMed
- Tachioka M, Sugimoto N, Nakamura A, Sunagawa N, Ishida T, et al. 2016. Development of simple random mutagenesis protocol for the protein expression system in Pichia pastoris. Biotechnol Biofuels. 9: 199.ArticlePubMedPMCPDF
- Tan Y, Zheng J, Hong L, Zhou B. 2024. ProtSolM: protein solubility prediction with multi-modal features. arXiv:240619744.ArticleLink
- Tang NC, Su JC, Shmidov Y, Kelly G, Deshpande S, et al. 2024. Synthetic intrinsically disordered protein fusion tags that enhance protein solubility. Nat Commun. 15(1): 3727.ArticlePubMedPMCPDF
- Taylor T, Denson JP, Esposito D. 2017. Optimizing expression and solubility of proteins in E. coli using modified media and induction parameters. Methods Mol Biol. 1586: 65–82. ArticlePubMed
- Thabtah F, Hammoud S, Kamalov F, Gonsalves A. 2020. Data imbalance in classification: experimental evaluation. Inf Sci. 513: 429–441. Article
- Thumuluri V, Martiny HM, Almagro Armenteros JJ, Salomon J, Nielsen H, et al. 2022. NetSolP: predicting protein solubility in Escherichia coli using language models. Bioinformatics. 38(4): 941–946. ArticlePubMedPDF
- Tripathi NK, Shrivastava A. 2019. Recent developments in bioprocessing of recombinant proteins: expression hosts and process development. Front Bioeng Biotechnol. 7: 420.ArticlePubMedPMC
- Uemura E, Niwa T, Minami S, Takemoto K, Fukuchi S, et al. 2018. Large-scale aggregation analysis of eukaryotic proteins reveals an involvement of intrinsically disordered regions in protein folding. Sci Rep-Uk. 8(1): 678.ArticlePubMedPMCPDF
- Velecky J, Hamsikova M, Stourac J, Musil M, Damborsky J, et al. 2022. SoluProtMut: a manually curated database of protein solubility changes upon mutations. Comput Struct Biotechnol J. 20: 6339–6347. ArticlePubMedPMC
- Wang B, Xu J, Gao J, Fu X, Han H, et al. 2019. Construction of an Escherichia coli strain to degrade phenol completely with two modified metabolic modules. J Hazard Mater. 373: 29–38. ArticlePubMed
- Wang J, Yang B, Revote J, Leier A, Marquez-Lago TT, et al. 2017. POSSUM: a bioinformatics toolkit for generating numerical sequence feature descriptors based on PSSM profiles. Bioinformatics. 33(17): 2756–2758. ArticlePubMedPDF
- Wang C, Zou Q. 2023. Prediction of protein solubility based on sequence physicochemical patterns and distributed representation information with DeepSoluE. BMC Biol. 21(1): 12.ArticlePubMedPMCPDF
- Waterhouse A, Bertoni M, Bienert S, Studer G, Tauriello G, et al. 2018. SWISS-MODEL: homology modelling of protein structures and complexes. Nucleic Acids Res. 46(W1): W296–W303. ArticlePubMedPMC
- Xiao N, Cao DS, Zhu MF, Xu QS. 2015. protr/ProtrWeb: R package and web server for generating various numerical representation schemes of protein sequences. Bioinformatics. 31(11): 1857–1859. ArticlePubMedPDF
- Xiao S, Shiloach J, Betenbaugh MJ. 2014. Engineering cells to improve protein expression. Curr Opin Struc Biol. 26: 32–38. ArticlePubMedPMC
- Yang Y, Zeng L, Vihinen M. 2021. PON-Sol2: prediction of effects of variants on protein solubility. Int J Mol Sci. 22(15): 8027.ArticlePubMedPMC
- Zhang X, Hu X, Zhang T, Yang L, Liu C, et al. 2024. PLM_Sol: predicting protein solubility by benchmarking multiple protein language models with the updated Escherichia coli protein solubility dataset. Brief Bioinform. 25(5): bbae404.ArticlePubMedPMC
- Zhang P, Tao L, Zeng X, Qin C, Chen SY, et al. 2017. PROFEAT update: a protein features web server with added facility to compute network descriptors for studying omics-derived networks. J Mol Biol. 429(3): 416–425. ArticlePubMed
References
Supplementary Information
References
Citations
- MPRL: Multi-perspective representation learning for accurate and generalizable protein solubility prediction
Xiongyan Yang, Shouyong Jiang, Yong Wang, Jinsong Gong
Expert Systems with Applications.2026; 308: 131142. CrossRef - Artificial Intelligence in Chemical Engineering: Protein Design from First Principles to Structural Prediction
Joseph S. Bailey, Søren C. Spina, Andrew Hu, Nathan Phan, Rachel B. Getman, Blaise R. Kimmel
ACS Engineering Au.2026; 6(2): 249. CrossRef
 ePub Link
 Cite this Article
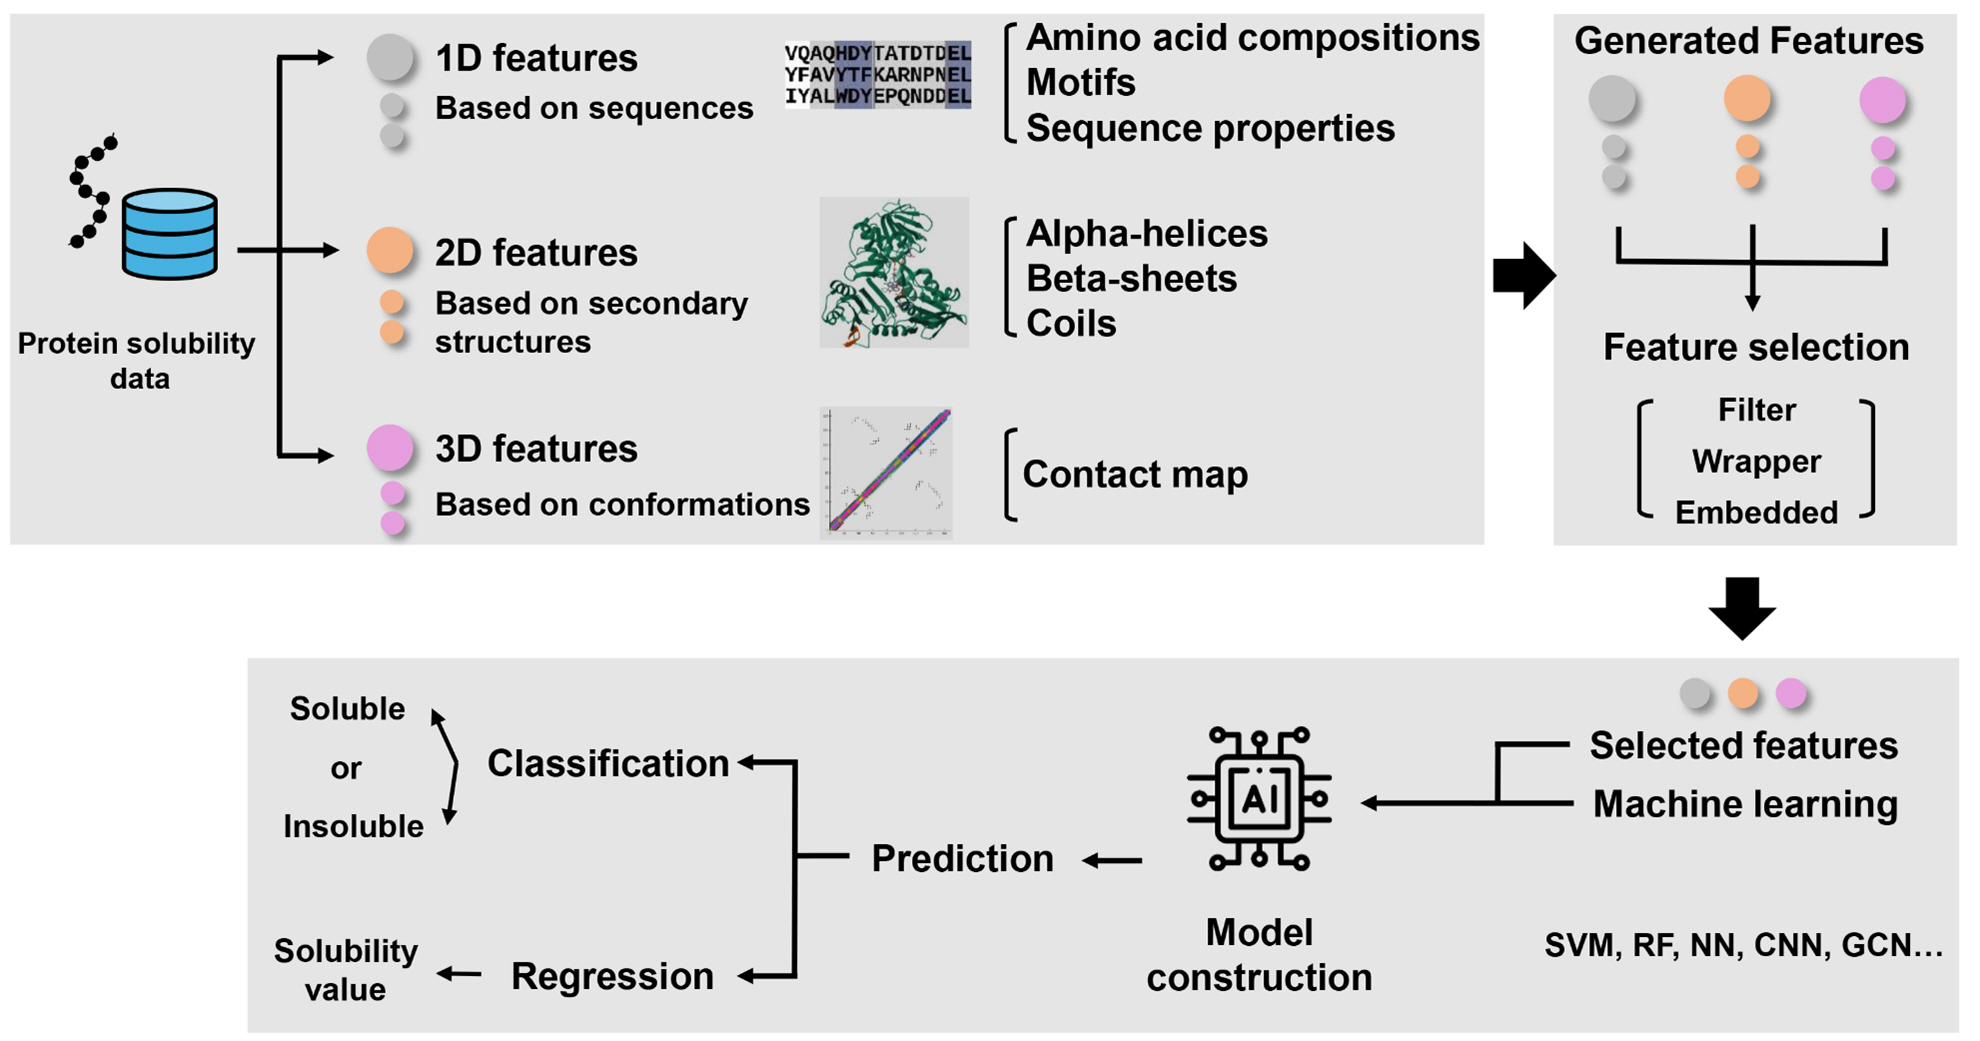

Fig. 1.
| Model | Dataset (soluble + insoluble) | Machine learning algorithm | Features | Performances | Pros | Cons | References | |
|---|---|---|---|---|---|---|---|---|
| Classification models | PROSO | E. coli | Chained models of SVM and naïve Bayes | Amino acid compositions and alpha-helical structure composition | Crossvalidation: | Computationally efficient, simple to use | Lacks structural data, limited in complex solubility cases | |
| > 14,000 | Accuracy: 0.72 | |||||||
| (50% and 50%)1) | AUC: 0.78 | |||||||
| Model is not available to access | ||||||||
| SOLpro | E. coli | Chained 20 SVM models with 1 SVM output model | Compositions (amino acids, dipeptides, and tripeptides), physicochemical properties (hydropathy, charge, molecular weight, aliphatic index, etc.), secondary structure composition, exposed residues, number of domains, etc. | Crossvalidation: | Advanced SVM-based architecture, better accuracy | Constrained by sequence-only features, no structural insight | ||
| 17408 | Accuracy: 0.74 | |||||||
| (8,704+8,704) | AUC: 0.74 | |||||||
| Web-based tool is available at |
||||||||
| PROSO II | E. coli | Chained model: two input models of Parzen window model and logistic regression classifier, and an output model of logistic regression classifier | Compositions (amino acids, dipeptides, and tripeptides), physicochemical properties (isoelectric point, GRAVY index, etc.), secondary structures, exposed residues, and number of domains | Independent test: | Improved with larger datasets and refined algorithms | No structural data, reduced accuracy for complex proteins | ||
| 82,2992) | Accuracy: 0.75 | |||||||
| for training | ||||||||
| 1765 | ||||||||
| (⅙ + ⅚)1) | ||||||||
| hold-out for test | ||||||||
| Model is not available to access | ||||||||
| PaRSnIP | E. coli | Gradient boosting machine | Compositions (amino acids, dipeptides, and tripeptidmagnes), sequence length, molecular weight, fraction of turn-forming residues, average hydropathicity, aliphatic index, absolute charge, secondary structures, hydrophobicity of exposed residues. | Independent test: | Effective use of GBM for feature handling | Relies on manual feature selection, no structural data | ||
| 69420 | Accuracy: 0.74 | |||||||
| (28,972+40,448) for training | MCC: 0.48 | |||||||
| 2001 | ||||||||
| (1,000+1,001)3) for testing | ||||||||
| Source codes are available at |
||||||||
| DeepSol | E. coli | Convolutional neural network | Amino acid compositions, molecular weight, absolute charge, aliphatic index, average hydropathicity (GRAVY), fraction of turn-forming residues, secondary structures, fraction of exposed residues, and hydrophobicity of exposed residues. | Independent test: | Automated feature learning with higher accuracy | Lacks structural data, limited for complex proteins | ||
| 69420 | Accuracy: 0.77 | |||||||
| (28,972+40,448) for training | MCC4): 0.55 | |||||||
| 2001 | ||||||||
| (1,000+1,001)3) for testing | ||||||||
| Source codes are available at |
||||||||
| SoluProt | E. coli | Gradient boosting machine | Compositions (amino acids and dipeptides), physicochemical properties, average flexibility, secondary structure content, average disorder, residue content in transmembrane helices, maximum identity to E. coli proteins in PDB | Independent test: | Robust handling of noisy data, effective feature selection | Lower accuracy and MCC, less suited for high-precision tasks | ||
| 11436 | Accuracy: 0.59 | |||||||
| (5,718+5,718) for training | MCC: 0.17 | |||||||
| 3100 | ||||||||
| (1,550+1,550) for testing | ||||||||
| Web-based tool and datasets are available at |
||||||||
| NetSolP | E. coli | Two input models, ESM1b and ProtT5 transformer-based models, with an output passed to a classification layer | Sequence embeddings (from transformer models like ESM1b and ProtT5), sequence profiles (MSAs generated using HHblits), and amino acid conservation (calculated using conservation scores). | Independent test: | Transformer-based model captures complex sequence-residue interactions | Moderate accuracy and MCC, computationally demanding | ||
| 12216 | Accuracy: 0.76 | |||||||
| (66% + 34%)1) for training | MCC: 0.40 | |||||||
| 1323 | ||||||||
| (620+703) for testing | ||||||||
| Source codes are available at |
||||||||
| PROTSOLM | E. coli | Multi-modal model: two input models, ESM2 for protein sequence embedding and equivariant graph neural networks (EGNNs) for structural feature encoding, combined with an output model of a deep learning classifier. Gradient boosting machine | Sequence embeddings (ESM2-650M), inter-residue distances, backbone geometry, physicochemical properties (charged residues, GRAVY index, and turn-forming residues), secondary structure content, solvent accessibility, hydrogen bond density, hydrophobicity of exposed residues, and structure confidence (pLDDT from ESMFold). | Independent test: | Multimodal approach integrates sequence and structure data | Dependence on structural data may limit broad applicability | ||
| 64598 | Accuracy: 0.79 | |||||||
| (33,763+30,835) for training | MCC: 0.58 | |||||||
| 3230 | Independent test: | |||||||
| (1,675+1,555) for testing | Accuracy: 0.60 | |||||||
| MCC: 0.22 | ||||||||
| 2155 | Independent test: | |||||||
| (951+1,204)6) for testing | Accuracy: 0.60 | |||||||
| MCC: 0.23 | ||||||||
| 1784 | ||||||||
| (1,052+732)6) for testing | ||||||||
| 3640 | Independent test: | |||||||
| (1,817+1,823)6) for testing | Accuracy: 0.60 | |||||||
| MCC: 0.21 | ||||||||
| Source codes are available at |
||||||||
| PLM_Sol | E. coli | Two input embedding models, ProtT5 and ESM2, are combined with an output model of biLSTM_TextCNN layer | Protein sequence embeddings (capturing contextual information such as residue-level interactions and sequence structure). | Independent test: | Leverages PLMs for richer contextual embeddings | Computationally intensive, dependent on large datasets | ||
| 79344 | Accuracy: 0.72 | |||||||
| (47,291+32,053) for training | MCC: 0.46 | |||||||
| 4000 | ||||||||
| (2,000+2,000) for testing | ||||||||
| Source codes are available at |
||||||||
| DeepSoluE | E. coli | Long Short-Term Memory network | Physicochemical properties (isoelectric point, aromaticity, molecular weight, flexibility, and instability index), sequence embedding, and secondary structure content, along with structural-based features (protein sequence length, residue-level solvent accessibility, and torsion angle domain). | Independent test: | Balanced approach, integrates physicochemical features | Moderate accuracy and MCC, less suited for high-precision tasks | ||
| 11436 | Accuracy: 0.59 | |||||||
| (5,718+ 5,718) for training | MCC: 0.18 | |||||||
| 3100 | ||||||||
| (1,550+1,550) for testing | ||||||||
| Web-based tool and datasets are available at |
||||||||
| Regression models | SOLart | E. coli | Random forest | Compositions of amino acids, secondary structure content, protein length, protein solvent accessibility, and statistical potentials (residue-level solvent accessibility and torsion angle domain). | Independent tests: | Accurate for quantitative solubility predictions, strong cross-species performance | Limited by dependence on 3D structural data | |
| 4065) for training | on E. coli | |||||||
| R2: 0.448 | ||||||||
| E. coli | RMSE: 23% | |||||||
| 5505) for testing | on S. cerevisiae | |||||||
| R2: 0.608, 0.490 | ||||||||
| S. cerevisiae | RMSE: 23%, 20% | |||||||
| 59 and 505) for testing | ||||||||
| Web-based tool is available at |
||||||||
| SVR Model | E. coli | Support Vector Regression | Compositions of amino acids | Independent tests: | Efficient solubility optimization, successful experimental validation and versatile applicability | No internal test dataset and limited consideration of stability | ||
| 3,1485) for training | on E. coli | |||||||
| R2: 0.57 | ||||||||
| 4 proteins5) | ||||||||
| for experimental validation | ||||||||
| Source codes are available at |
||||||||
| GraphSol | E. coli | Graph convolutional network | Hidden Markov model, PSSM, diverse physicochemical properties (steric parameters, hydrophobicity, volume, polarizability, isoelectric point, etc.), relative solvent accessible surface area, backbone torsion angles, protein contact map, etc. | Independent tests: | Strong integration of sequence and structure | Dependent on structural data, limiting generalizability | ||
| 20525) for training | on E. coli | |||||||
| R2: 0.48 | ||||||||
| E. coli | on S. cerevisiae | |||||||
| 6855) for testing | R2: 0.37 | |||||||
| S. cerevisiae | ||||||||
| 1085) for testing | ||||||||
| Source codes are available at |
||||||||
| Tool name | Number of features | Feature | URL | References |
|---|---|---|---|---|
| PROFEAT | < 2,000 | Residue compositions, physicochemical properties, sequence order and secondary structures, topological characteristics, interaction patterns, and other network properties | ||
| iFeatureOmega | > 18,000 | Residue compositions, physicochemical properties, sequence order and secondary structures, half sphere exposure, residue depth, atom composition and network-based index | ||
| protr | 22700 | Residue compositions, physicochemical properties, secondary structure, similarity score, customizable descriptors (AAindex database), Auxiliary functions | ||
| Rcpi | > 10,000 | Residue composition, physicochemical properties, secondary structures, PSSM profile, PCM, GO similarity, sequence similarity. Rcpi also provides compound-related features and protein-compound/protein-protein interactions features | ||
| Propy | 9547 | Residue compositions, physicochemical properties, sequence order coupling numbers, pseudo amino acids compositions. | ||
| PDBparam | > 50 | Physicochemical properties, secondary structures, inter-residue interactions, identification of binding sites from PDB structure | ||
| POSSUM | 12010 | PSSM-based features | ||
| Pfeature | 200,000+ | Diverse sequence-based features, binary profiles, evolutionary information based on PSSM, structural features, and pattern-based features |
1) Only percentages or ratios have been reported. 2) The ratio of soluble and insoluble data has not been reported. 3) External qualitative solubility dataset from the study of Chang et al. (2014). 4) Mathew’s correlation coefficient (MCC), a balanced accuracy for imbalanced dataset. 5) Quantitative solubility datasets for regression model training and testing. 6) External qualitative solubility dataset from literature of Tan et al., Niwa et al., and Smialowski et al., respectively (
*Not accessible at the time of manuscript preparation.
Table 1.
Table 2.
TOP

