- About
- Browse Articles
-
Special Issues
- Pioneering strategies for overcoming bacterial drug resistance (2026)
- Advancing microbial engineering through synthetic biology (2025)
- Host-associated microbiome (2024)
- Bacterial regulatory mechanisms for the control of complex cellular mechanisms (2023)
- Two years into COVID-19 pandemic: Where are we? (2022)
- Collections
- For Contributors
- Policies
- E-Submission

- About
- Browse Articles
-
Special Issues
- Pioneering strategies for overcoming bacterial drug resistance (2026)
- Advancing microbial engineering through synthetic biology (2025)
- Host-associated microbiome (2024)
- Bacterial regulatory mechanisms for the control of complex cellular mechanisms (2023)
- Two years into COVID-19 pandemic: Where are we? (2022)
- Collections
- Policies
- For Contributors
Articles
- Page Path
- HOME > J. Microbiol > Volume 63(2); 2025 > Article
-
Full article
Synbiotic combination of fructooligosaccharides and probiotics ameliorates the metabolic dysfunction-associated steatotic liver disease - Sang Yoon Lee1,†, Su-Been Lee1,†, Goo-Hyun Kwon1, Seol Hee Song1, Jeong Ha Park1, Min Ju Kim1, Jung A Eom1, Kyeong Jin Lee1, Sang Jun Yoon1, Hyunjoon Park1,†, Sung-Min Won1, Jin-Ju Jeong1, Ki-Kwang Oh1, Young Lim Ham2, Gwang Ho Baik1,3, Dong Joon Kim1,3, Satya Priya Sharma1,†,*, Ki Tae Suk1,3,*
-
Journal of Microbiology 2025;63(2):e2411002.
DOI: https://doi.org/10.71150/jm.2411002
Published online: February 27, 2025
1Institute for Liver and Digestive Diseases, Hallym University, Chuncheon 24253, Republic of Korea
2Department of Nursing Daewon University College, Jecheon 27135, Republic of Korea
3Department of Internal Medicine, Hallym University College of Medicine, Chuncheon 24253, Republic of Korea
- *Correspondence Satya Priya Sharma satyapriya83@gmail.com Ki Tae Suk ktsuk@hallym.ac.kr
- †These authors contributed equally to this work.
© The Microbiological Society of Korea
This is an Open Access article distributed under the terms of the Creative Commons Attribution Non-Commercial License (http://creativecommons.org/licenses/by-nc/4.0) which permits unrestricted non-commercial use, distribution, and reproduction in any medium, provided the original work is properly cited.
ABSTRACT
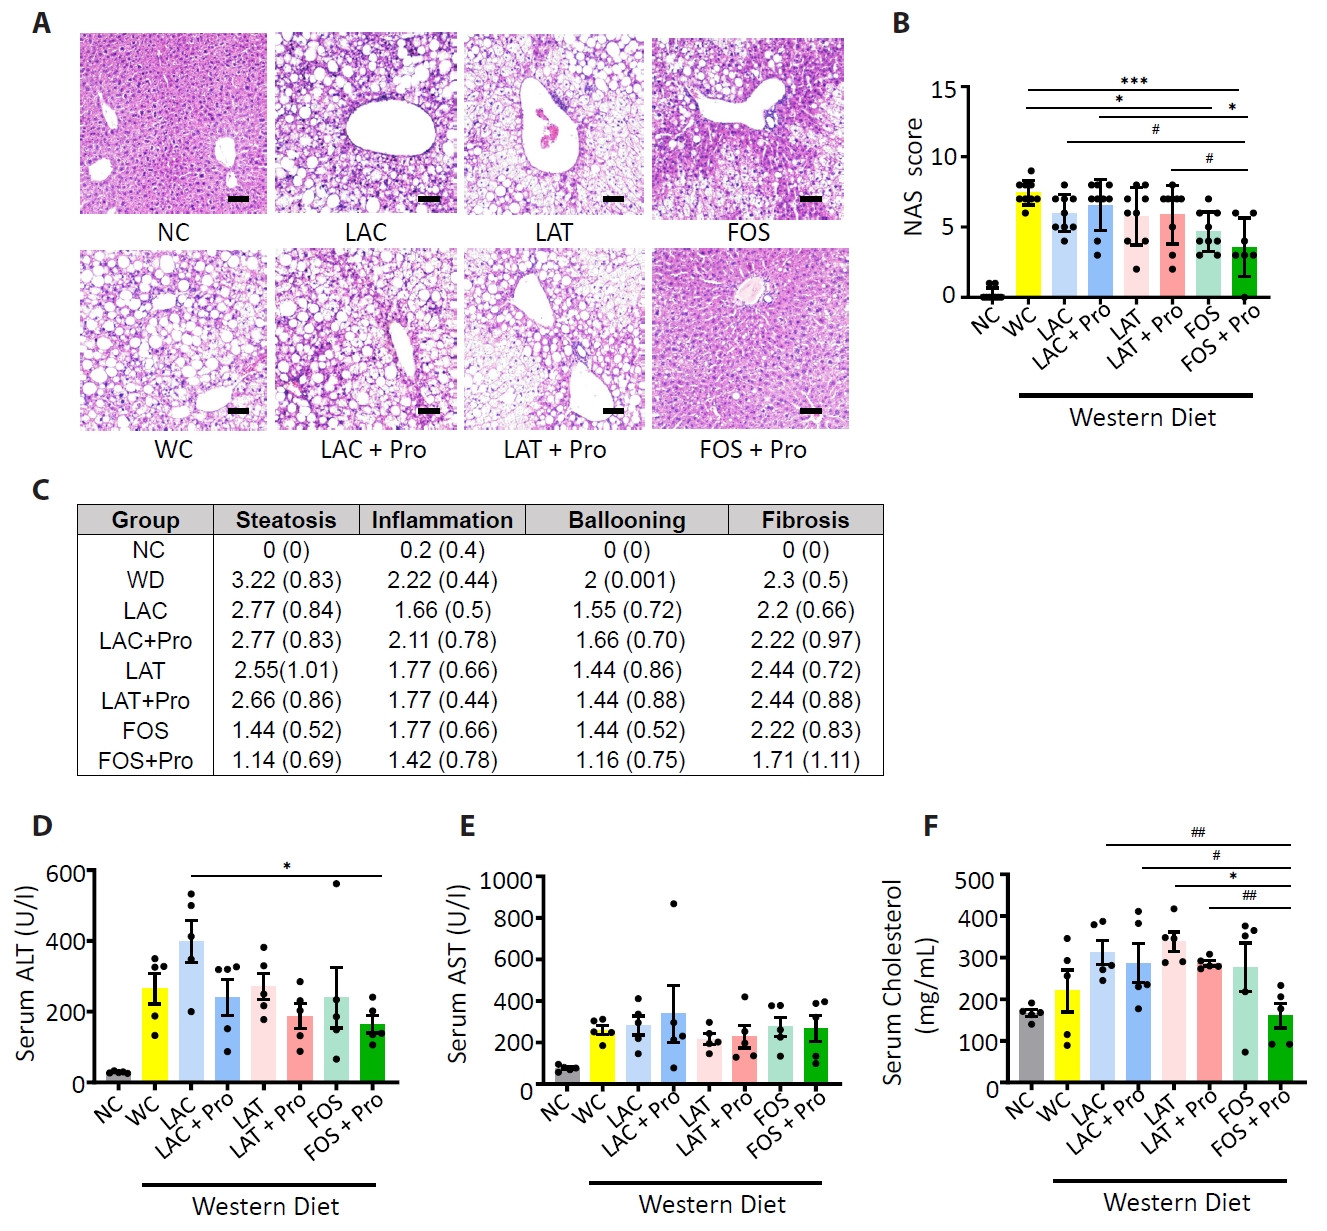
- Synbiotics have become a new-age treatment tool for limiting the progression of metabolic dysfunction-associated steatotic liver disease; however, inclusive comparisons of various synbiotic treatments are still lacking. Here, we have explored and evaluated multiple synbiotic combinations incorporating three distinctive prebiotics, lactitol, lactulose and fructooligosaccharides. Of the synbiotic treatments evaluated, a combination of fructooligosaccharides and probiotics (FOS+Pro) exhibited superior protection against western diet-induced liver degeneration. This synbiotic (FOS+Pro) combination resulted in the lowest body weight gains, liver weights and liver/body weight ratios. The FOS+Pro synbiotic combination substantially alleviated liver histopathological markers and reduced serum AST and cholesterol levels. FOS+Pro ameliorated hepatic inflammation by lowering expression of proinflammatory markers including TNF-α, IL-1β, IL-6, and CCL2. FOS+Pro significantly improved steatosis by restricting the expression of lipid metabolic regulators (ACC1, FAS) and lipid transporters (CD36) in the liver. These findings are critical in suggesting that synbiotic treatments are capable of restraining western diet-induced metabolic dysfunction in the liver. Additionally, this study demonstrated that adding probiotic strains amplified the effectiveness of fructooligosaccharides but not all prebiotics.
Introduction
Materials and Methods
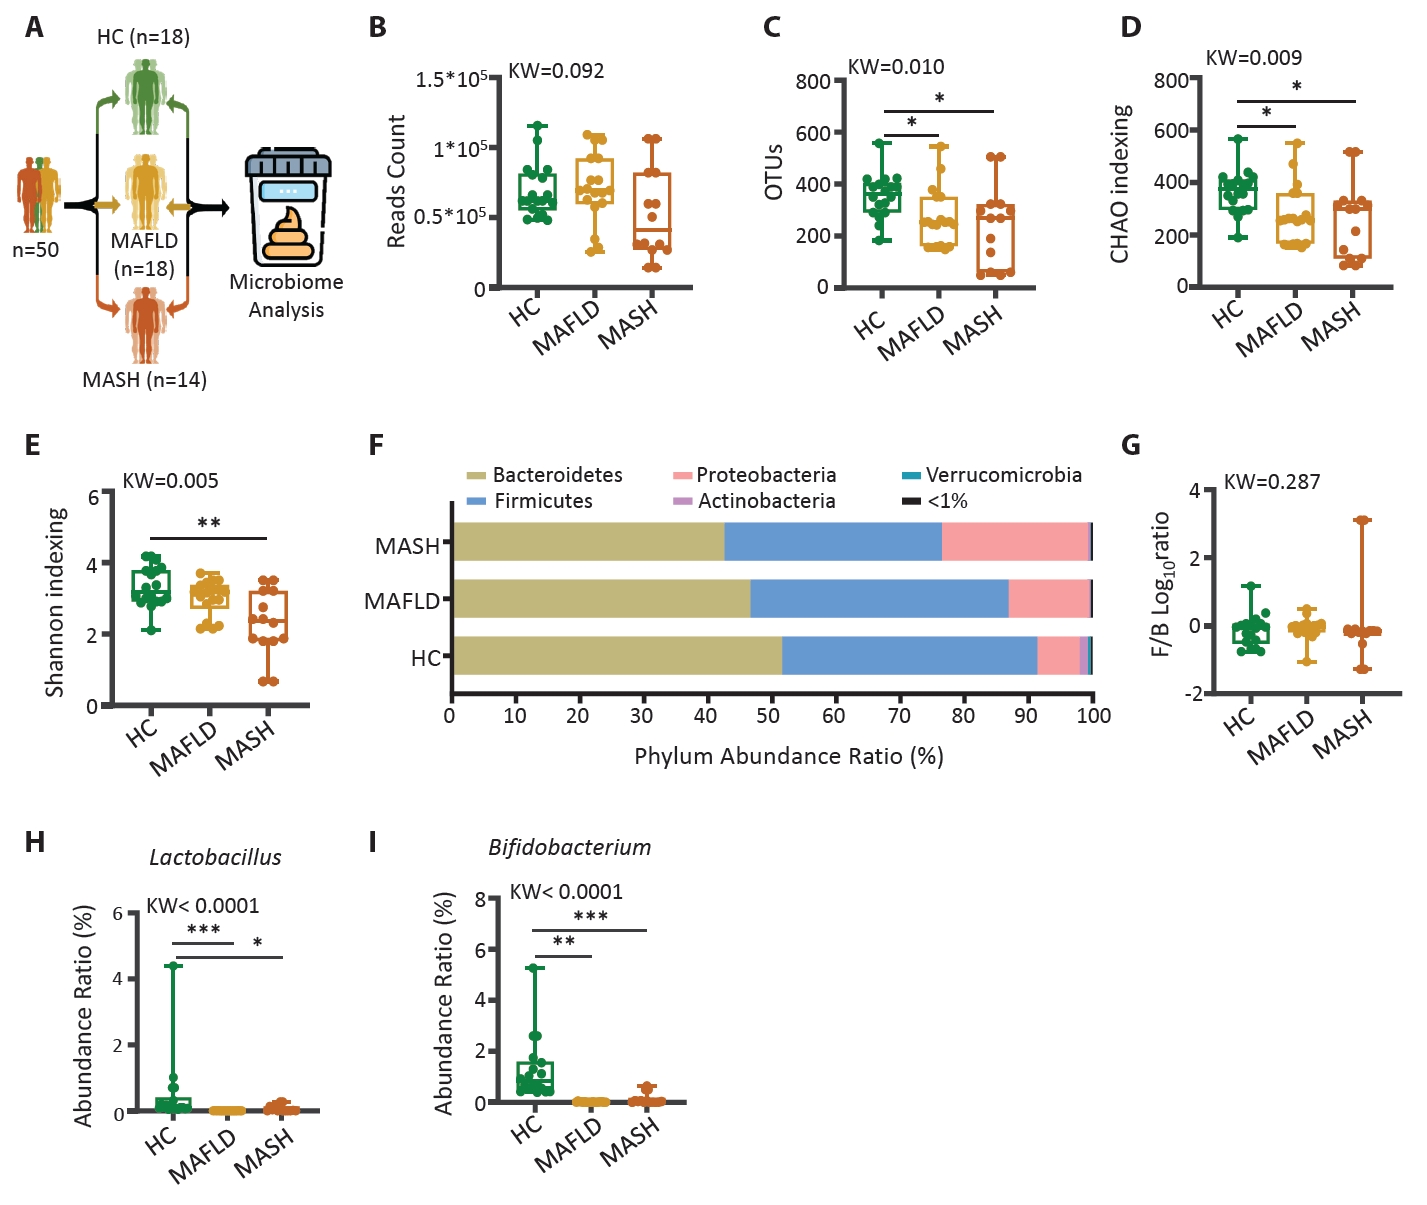
Human data
Animal data
Results
Discussion
Acknowledgments
This research was supported by the Hallym University Research Fund, the Basic Science Research Program through the National Research Foundation of Korea (NRF) funded by the Ministry of Education, Science and Technology (NRF-2020R1I1A3073530 and NRF-2020R1A6A1A03043026), the Korea Institute for Advancement of Technology (P0020622). All six probiotic bacterial strains were provided by CKDBiO, South Korea, which have been used in this experiment.
Author Contributions
As the corresponding authors S.P.S. and K.T.S. have full access to all the data used in the study and take all responsibility for the integrity of the presented data and the accuracy of the data analysis. Conception and design, administrative support, manuscript writing: S.P.S. Financial support: K.T.S. Collection and assembly of data: all authors. Data analysis and interpretation: all authors. Final approval of manuscript, accountable for all aspects of the work: all authors.
Conflict of Interest
All authors confirm that there are no conflicts of interests to disclose.


HC, healthy control; MAFLD, Metabolic dysfunction-associated fatty liver disease; MASH, Metabolic dysfunction-associated steatohepatitis; n, number; BMI, body mass index; AST, aspartate aminotransferase; ALT, alanine aminotransferase; Cr, creatinine; Chol, cholesterol; γ-GT, gamma glutamyl transpeptidase.
The statistical difference between groups mean value was measured by ANOVA; *p<0.05, and individual difference measured by two groups evaluated by t-test using Mann-Whitney test compare rank test #p<0.05.
- Aron-Wisnewsky J, Vigliotti C, Witjes J, Le P, Holleboom AG, et al. 2020. Gut microbiota and human NAFLD: Disentangling microbial signatures from metabolic disorders. Nat Rev Gastroenterol Hepatol. 17: 279–297. ArticlePubMedPDF
- Bauer KC, Littlejohn PT, Ayala V, Creus-Cuadros A, Finlay BB. 2022. Nonalcoholic fatty liver disease and the gut-liver axis: Exploring an undernutrition perspective. Gastroenterology. 162(7): 1858–1875. ArticlePubMed
- Bloom PP, Tapper EB. 2023. Lactulose in cirrhosis: Current understanding of efficacy, mechanism, and practical considerations. Hepatol Commun. 7(11): e0295.ArticlePubMedPMC
- Cao H, Cai Q, Guo W, Su Q, Qin H, et al. 2023. Malonylation of Acetyl-CoA carboxylase 1 promotes hepatic steatosis and is attenuated by ketogenic diet in NAFLD. Cell Rep. 42(4): 112319.ArticlePubMed
- Chen C, Yu X, Lu H, Xiao D, Mao W, et al. 2013. Antioxidant protective effects of lactitol against endotoxemia in patients with chronic viral hepatitis. Mol Med Rep. 7(2): 401–405. ArticlePubMed
- Cutler NS, Sadowski BW, MacGregor DA. 2022. Use of lactulose to treat hyperammonemia in ICU patients without chronic liver disease or significant hepatocellular injury. J Intensive Care Med. 37(5): 698–706. ArticlePubMedLink
- European Association for the Study of the Liver (EASL); European Association for the Study of Diabetes (EASD); European Association for the Study of Obesity (EASO). 2024. EASL-EASD-EASO Clinical Practice Guidelines on the management of metabolic dysfunction-associated steatotic liver disease (MASLD). J Hepatol. 81(3): 492–542. ArticlePubMedPMCPDF
- Ghosh TS, Shanahan F, O'Toole PW. 2022. The gut microbiome as a modulator of healthy ageing. Nat Rev Gastroenterol Hepatol. 19: 565–584. ArticlePubMedPMCPDF
- Hoogerland JA, Staels B, Dombrowicz D. 2022. Immune-metabolic interactions in homeostasis and the progression to NASH. Trends Endocrinol Metab. 33(10): 690–709. ArticlePubMed
- Horn P, Tacke F. 2024. Metabolic reprogramming in liver fibrosis. Cell Metab. 36(7): 1439–1455. ArticlePubMed
- Hsu CL, Schnabl B. 2023. The gut-liver axis and gut microbiota in health and liver disease. Nat Rev Microbiol. 21: 719–733. ArticlePubMedPMCPDF
- Huang X, Chen Q, Fan Y, Yang R, Gong G, et al. 2023. Fructooligosaccharides attenuate non-alcoholic fatty liver disease by remodeling gut microbiota and association with lipid metabolism. Biomed Pharmacother. 159: 114300.ArticlePubMed
- Jennison E, Byrne CD. 2021. The role of the gut microbiome and diet in the pathogenesis of non-alcoholic fatty liver disease. Clin Mol Hepatol. 27(1): 22–43. ArticlePubMedPMCPDF
- Jin H, Xu X, Pang B, Yang R, Sun H, et al. 2021. Probiotic and prebiotic interventions for non-alcoholic fatty liver disease: A systematic review and network meta-analysis. Benef Microbes. 12(6): 517–529. ArticlePubMed
- Kim GA, Moon JH, Kim W. 2023. Critical appraisal of metabolic dysfunction-associated steatotic liver disease: Implication of janus-faced modernity. Clin Mol Hepatol. 29(4): 831–843. ArticlePubMedPMCPDF
- Lang S, Schnabl B. 2020. Microbiota and fatty liver disease-the known, the unknown, and the future. Cell Host Microbe. 28(2): 233–244. ArticlePubMedPMC
- Lee G, You HJ, Bajaj JS, Joo SK, Yu J, et al. 2020. Distinct signatures of gut microbiome and metabolites associated with significant fibrosis in non-obese NAFLD. Nat Commun. 11: 4982.ArticlePubMedPMCPDF
- Lee NY, Shin MJ, Youn GS, Yoon SJ, Choi YR, et al. 2021. Lactobacillus attenuates progression of nonalcoholic fatty liver disease by lowering cholesterol and steatosis. Clin Mol Hepatol. 27(1): 110–124. ArticlePubMedPMCPDF
- Loman BR, Hernández-Saavedra D, An R, Rector RS. 2018. Prebiotic and probiotic treatment of nonalcoholic fatty liver disease: A systematic review and meta-analysis. Nutr Rev. 76(11): 822–839. ArticlePubMed
- Lu H, Chen L, Pan X, Yao Y, Zhang H, et al. 2021. Lactitol supplementation modulates intestinal microbiome in liver cirrhotic patients. Front Med (Lausanne). 8: 762930.ArticlePubMedPMC
- Malaguarnera M, Vacante M, Antic T, Giordano M, Chisari G, et al. 2012. Bifidobacterium longum with fructo-oligosaccharides in patients with non-alcoholic steatohepatitis. Dig Dis Sci. 57: 545–553. ArticlePubMedPDF
- Naghipour A, Amini-Salehi E, Orang Gorabzarmakhi M, Shahdkar M, Fouladi B, et al. 2023. Effects of gut microbial therapy on lipid profile in individuals with non-alcoholic fatty liver disease: An umbrella meta-analysis study. Syst Rev. 12: 144.ArticlePubMedPMCPDF
- Odenwald MA, Lin H, Lehmann C, Dylla NP, Cole CG, et al. 2023. Bifidobacteria metabolize lactulose to optimize gut metabolites and prevent systemic infection in patients with liver disease. Nat Microbiol. 8: 2033–2049. ArticlePubMedPMCPDF
- Pan Y, Yang Y, Wu J, Zhou H, Yang C. 2024. Efficacy of probiotics, prebiotics, and synbiotics on liver enzymes, lipid profiles, and inflammation in patients with non-alcoholic fatty liver disease: A systematic review and meta-analysis of randomized controlled trials. BMC Gastroenterol. 24: 283.ArticlePubMedPMCPDF
- Peiseler M, Schwabe R, Hampe J, Kubes P, Heikenwälder M, et al. 2022. Immune mechanisms linking metabolic injury to inflammation and fibrosis in fatty liver disease - novel insights into cellular communication circuits. J Hepatol. 77(4): 1136–1160. ArticlePubMed
- Rada P, González-Rodríguez Á, García-Monzón C, Valverde ÁM. 2020. Understanding lipotoxicity in NAFLD pathogenesis: Is CD36 a key driver? Cell Death Dis. 11: 802.ArticlePubMedPMCPDF
- Rong L, Ch'ng D, Jia P, Tsoi KKF, Wong SH, et al. 2023. Use of probiotics, prebiotics, and synbiotics in non-alcoholic fatty liver disease: A systematic review and meta-analysis. J Gastroenterol Hepatol. 38(10): 1682–1694. ArticlePubMed
- Ross FC, Patangia D, Grimaud G, Lavelle A, Dempsey EM, et al. 2024. The interplay between diet and the gut microbiome: Implications for health and disease. Nat Rev Microbiol. 22: 671–686. ArticlePubMedPDF
- Sharma SP, Gupta H, Kwon GH, Lee SY, Song SH, et al. 2024. Gut microbiome and metabolome signatures in liver cirrhosis-related complications. Clin Mol Hepatol. 30(4): 845–862. PubMedPMC
- Sharpton SR, Schnabl B, Knight R, Loomba R. 2021. Current concepts, opportunities, and challenges of gut microbiome-based personalized medicine in nonalcoholic fatty liver disease. Cell Metab. 33(1): 21–32. ArticlePubMedPMC
- Sorbara MT, Pamer EG. 2022. Microbiome-based therapeutics. Nat Rev Microbiol. 20: 365–380. ArticlePubMedPDF
- Sutti S, Albano E. 2020. Adaptive immunity: An emerging player in the progression of NAFLD. Nat Rev Gastroenterol Hepatol. 17: 81–92. ArticlePubMedPMCPDF
- Swanson KS, Gibson GR, Hutkins R, Reimer RA, Reid G, et al. 2020. The international scientific association for probiotics and prebiotics (ISAPP) consensus statement on the definition and scope of synbiotics. Nat Rev Gastroenterol Hepatol. 17: 687–701. ArticlePubMedPMCPDF
- Takai A, Kikuchi K, Ichimura M, Tsuneyama K, Moritoki Y, et al. 2020. Fructo-oligosaccharides ameliorate steatohepatitis, visceral adiposity, and associated chronic inflammation via increased production of short-chain fatty acids in a mouse model of non-alcoholic steatohepatitis. BMC Gastroenterol. 20: 46.ArticlePubMedPMCPDF
- Tilg H, Adolph TE, Trauner M. 2022. Gut-liver axis: Pathophysiological concepts and clinical implications. Cell Metab. 34(11): 1700–1718. ArticlePubMed
- Vacca M, Kamzolas I, Harder LM, Oakley F, Trautwein C, et al. 2024. An unbiased ranking of murine dietary models based on their proximity to human metabolic dysfunction-associated steatotic liver disease (MASLD). Nat Metab. 6: 1178–1196. PubMedPMC
- Wang R, Tang R, Li B, Ma X, Schnabl B, et al. 2021. Gut microbiome, liver immunology, and liver diseases. Cell Mol Immunol. 18: 4–17.ArticlePubMedPMCPDF
- Xu X, Poulsen KL, Wu L, Liu S, Miyata T, et al. 2022. Targeted therapeutics and novel signaling pathways in non-alcohol-associated fatty liver/steatohepatitis (NAFL/NASH). Signal Transduct Target. 7: 287.ArticlePubMedPMCPDF
References
Supplementary Information
References
Citations
- Uric Acid in Metabolic Dysfunction‐Associated Steatotic Liver Disease
Rong Wang, Zhenyu Liu, Jun Lin, Weijing Zhang, Xianzhi Liu, Tong Zhang
Portal Hypertension & Cirrhosis.2026;[Epub] CrossRef - Lactiplantibacillus plantarum ZJ316 synergizes with tryptophan diet to modulate gut microbiota and metabolite profiles in mice
Qingqing Zhou, Yingying Zhou, Lu Li, Kening Fu, Shibo Liu, Ping Li, Qing Gu
Food Bioscience.2026; 79: 108605. CrossRef - Effects of Probiotic and Synbiotic Supplementation on Metabolic and Hepatic Outcomes in Children and Adolescents With Obesity, Including Those With Obesity‐Related Metabolic Dysfunction–Associated Steatotic Liver Disease: A Systematic Review and Meta‐Anal
Pedram Pam, Mohammad Safari, Ali Hojati, Rasoul Zarrin, Amir Hossein Faghfouri
Journal of Paediatrics and Child Health.2026; 62(5): 678. CrossRef - Impact of probiotics and prebiotics on glucose/lipid metabolism in metabolic dysfunction-associated steatotic liver disease: mechanisms and implications
Yinan Zhao, Ziyan Li, Guoying Yu
Frontiers in Nutrition.2026;[Epub] CrossRef - Therapeutic Potential of Probiotics in Metabolic Dysfunction-Associated Steatohepatitis: A Comprehensive Review
Xueying Wang, Zhiying Wei, Qing Xiang, Lijie Tang, Weichun Xie
Microorganisms.2025; 13(8): 1894. CrossRef - Profiling oligosaccharide components in Polygonatum kingianum with potential anti-NAFLD activity using UPLC-Orbitrap-MS/MS technology
Hong Guo, Rui Yao, Jing Fan, Ying Wang, Lingzhi Zhang, Hua Sun, Xiaohan Guo, Jianbo Yang, Jingzhe Pu, Yazhong Zhang, Baozhong Duan, Jia Chen, Wenguang Jing, Xianlong Cheng, Feng Wei
Food Hydrocolloids for Health.2025; 8: 100248. CrossRef - Probiotics and cholesterol metabolism: new frontiers in science from intestinal microecology to cardiovascular health
Yue Li, Dayong Ren
Food Science of Animal Products.2025; 4(1): 9240146. CrossRef
 ePub Link
 Cite this Article
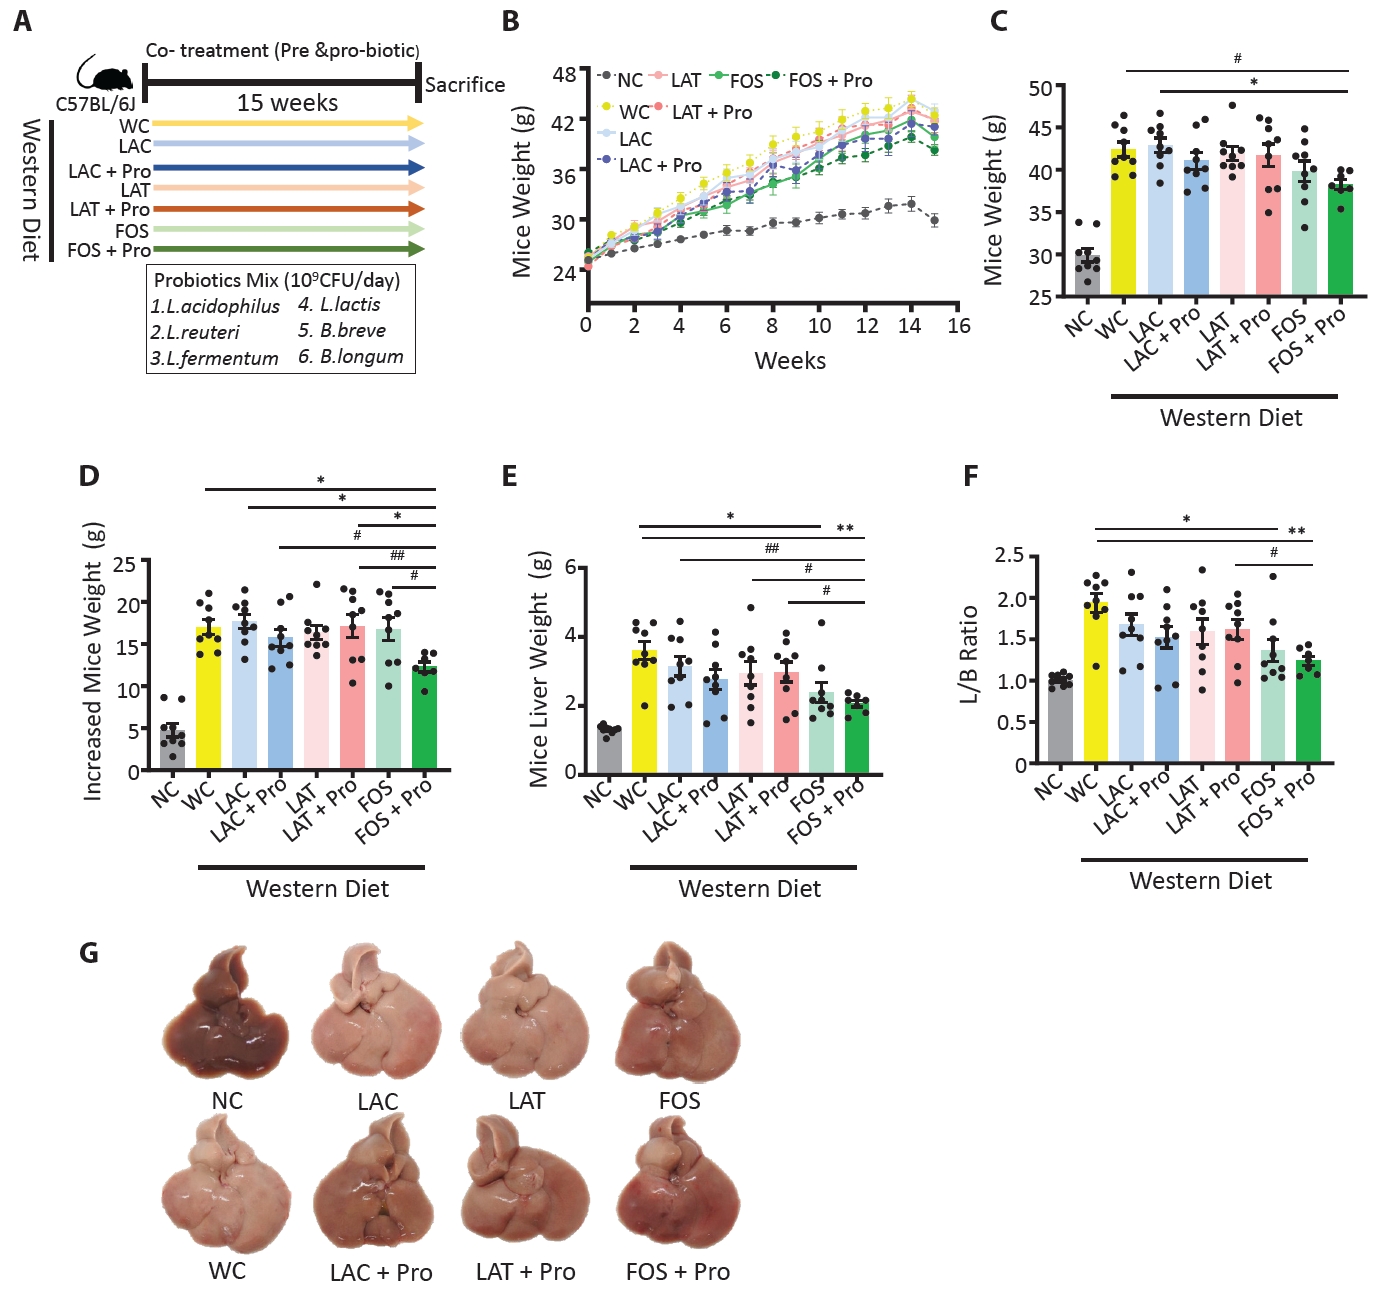

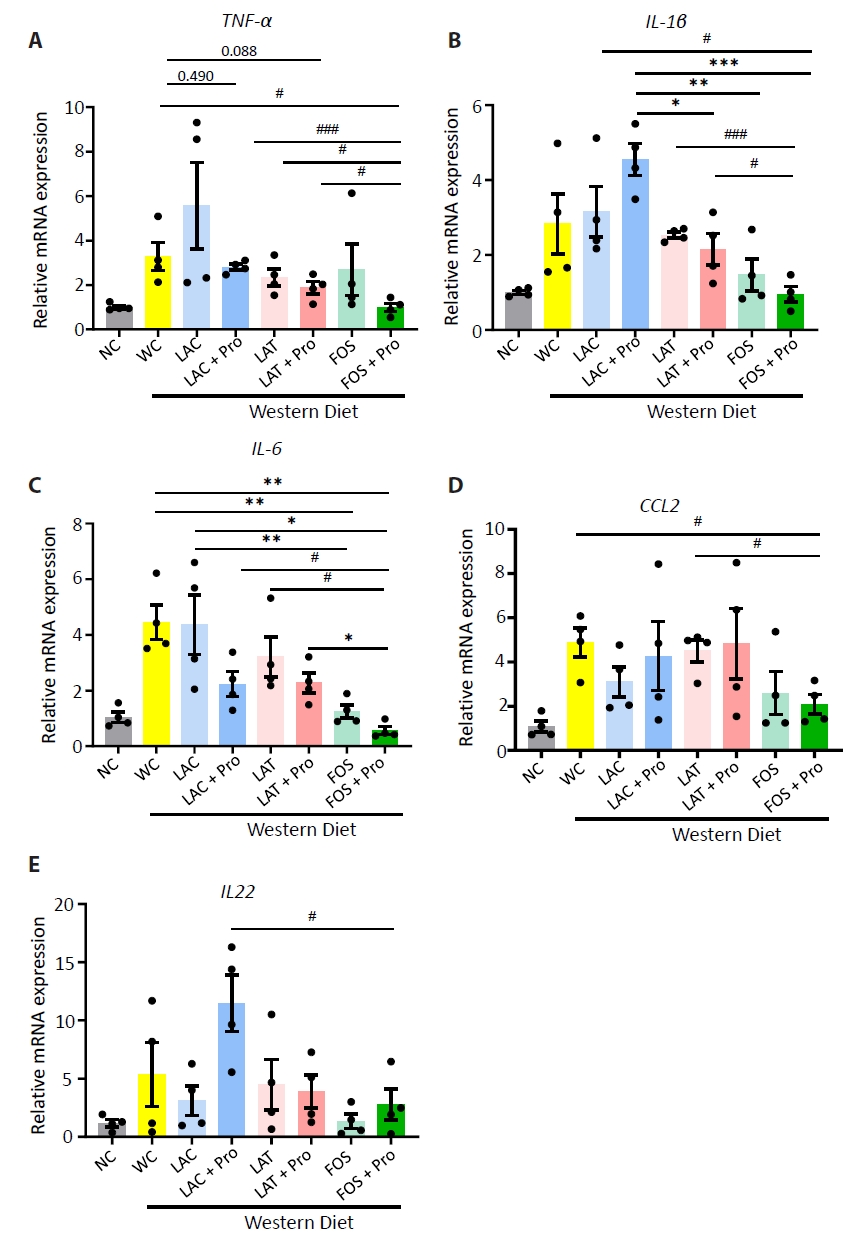
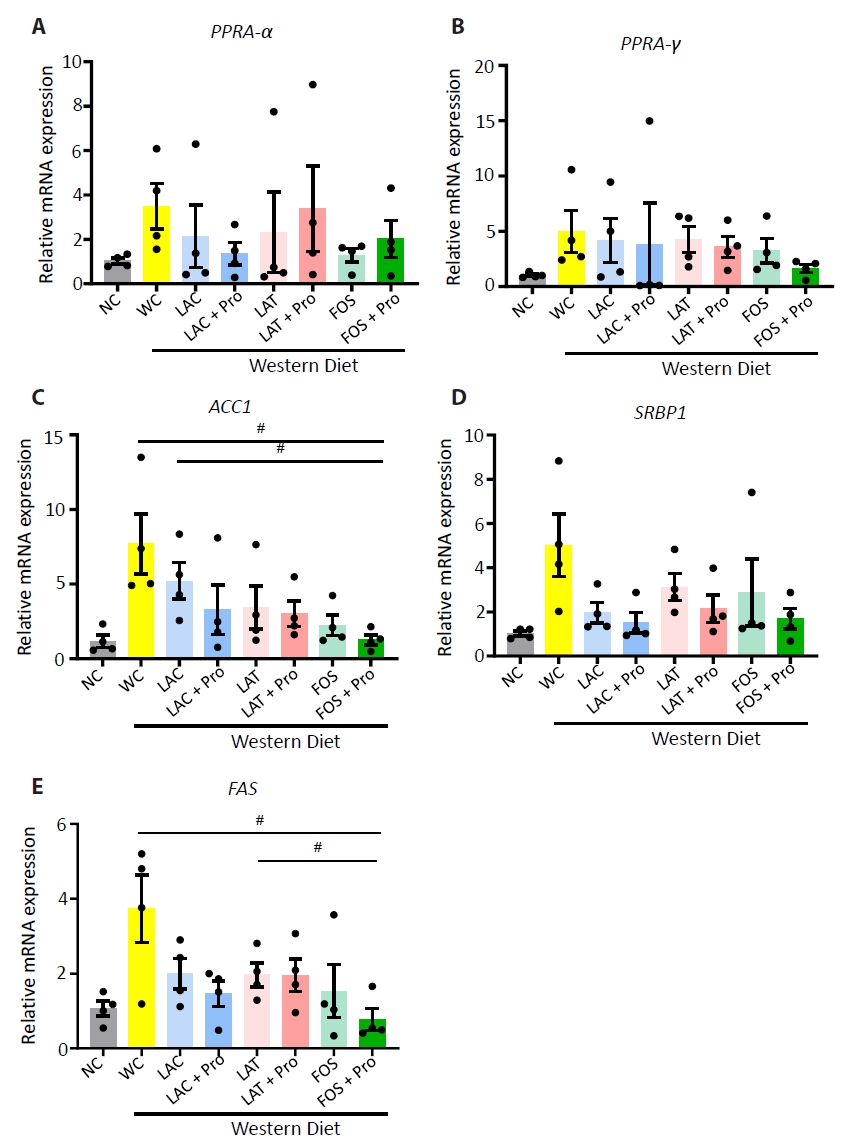
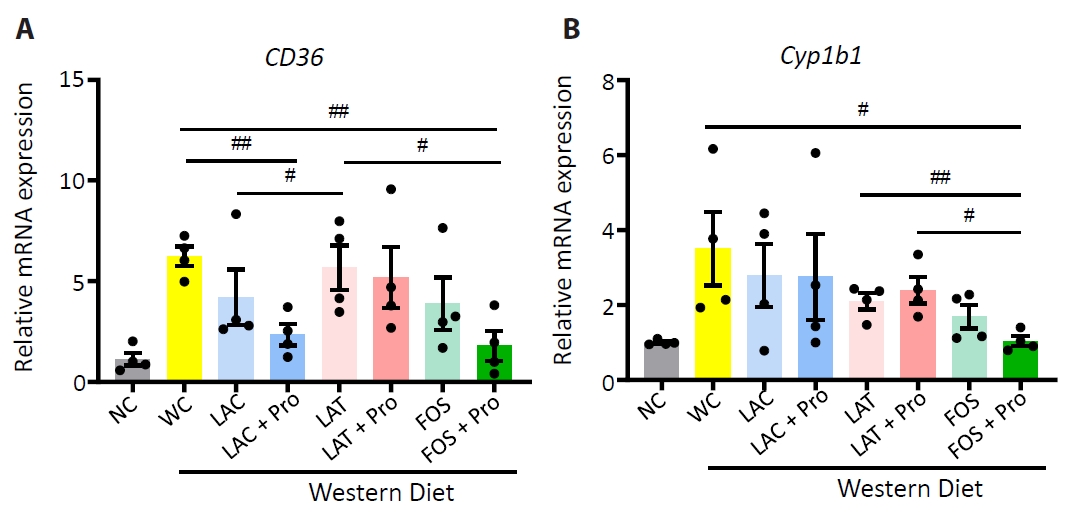


Fig. 1.
Fig. 2.
Fig. 3.
Fig. 4.
Fig. 5.
Fig. 6.
| Parameters | HC | MAFLD | MASH |
|---|---|---|---|
| Mean (SD) | (n=18) | (n=18) | (n=14) |
| Age (years) | 59.7 (10.1) | 57.0 (11.5) | 57.5 (17.3) |
| Female (n, %) | 10 (56%) | 14 (78%) | 4 (29%) |
| BMI (kg/m2) | 21.7 (1.7) | 27.6 (1.1)*** | 28.2 (1.5)*** |
| AST (IU/L) | 23.4 (5.3) | 58.3 (28.9)*** | 52.7 (8.2)*** |
| ALT(IU/L) | 20.8 (9.9) | 61.2 (48.3)*** | 64.6 (12.1)*** |
| Cr (mg/dL) | 0.87 (0.17) | 0.82 (0.2) | 0.98 (0.11)# |
| Cho (mg/dL) | 196.4 (44.8) | 216.1 (57.2) | 230.0 (57.0) |
| HDL (mg/dL) | 60.5 (19.7) | 53.0 (9.5) | 47.6 (14.7) |
| TG (mg/dL) | 134.9 (157.8) | 184.1 (92.0) | 168.0 (24.6) |
| γ-GT (IU/L) | 36.7 (49.5) | 76.3 (46.5)# | 204.8 (348.1)* |
| Gene name | Forward primer (5’ to 3’) | Reverse primer (5’ to 3’) |
|---|---|---|
| PPIA | GAGCTGTTTGCAGACAAAGTTC | CCCTGGCACATGAATCCTGG |
| Tnf-α | CCCCAAAGGGATGAGAAGTT | CACTTGGTGGTTTGCTACGA |
| Il-1β | GAAATGCCACCTTTTGACAGTG | TGGATGCTCTCATCAGGACAG |
| Il-6 | TAGTCCTTCCTACCCCAATTTCC | TTGGTCCTTAGCCACTCCTTC |
| Ccl2 | TCCCAATGAGTAGGCTGGAG | TCTGGACCCATTCCTTCTTG |
| Ppar-α | AGAAGTTGCAGGAGGGGATT | TCGGACTCGGTCTTCTTGAT |
| Ppar-γ | GGTGTGATCTTAACTGCCGGA | GCCCAAACCTGATGGCATTG |
| SEBP1 | TACTTCTTGTGGCCCGTACC | TCAGGTCATGTTGGAAACCA |
| FAS | AAGCGGTCTGGAAAGCTGAA | AGGCTGGGTTGATACCTCCA |
| ACC1 | CAGTAACCTGGTGAAGCTGGA | GCCAGACATGCTGGATCTCAT |
| CD36 | TGGCCAAGCTATTGCGACAT | ACACAGCGTAGATAGACCTGC |
| Cyp1b1 | GAATCATGACCCAGCCAAGT | TAATGAAGCCGTCCTTGT CC |
| IL22 | TTTCCTGACCAAACTCAGCA | TCTGGATGTTCTGGTCGTCA |
HC, healthy control; MAFLD, Metabolic dysfunction-associated fatty liver disease; MASH, Metabolic dysfunction-associated steatohepatitis; n, number; BMI, body mass index; AST, aspartate aminotransferase; ALT, alanine aminotransferase; Cr, creatinine; Chol, cholesterol; γ-GT, gamma glutamyl transpeptidase. The statistical difference between groups mean value was measured by ANOVA; *
Table 1.
Table 2.
TOP

