- About
- Browse Articles
-
Special Issues
- Pioneering strategies for overcoming bacterial drug resistance (2026)
- Advancing microbial engineering through synthetic biology (2025)
- Host-associated microbiome (2024)
- Bacterial regulatory mechanisms for the control of complex cellular mechanisms (2023)
- Two years into COVID-19 pandemic: Where are we? (2022)
- Collections
- For Contributors
- Policies
- E-Submission

- About
- Browse Articles
-
Special Issues
- Pioneering strategies for overcoming bacterial drug resistance (2026)
- Advancing microbial engineering through synthetic biology (2025)
- Host-associated microbiome (2024)
- Bacterial regulatory mechanisms for the control of complex cellular mechanisms (2023)
- Two years into COVID-19 pandemic: Where are we? (2022)
- Collections
- Policies
- For Contributors
Articles
- Page Path
- HOME > J. Microbiol > Volume 63(5); 2025 > Article
-
Full article
Time-resolved analysis of Bacillus subtilis DB104 Spo0A-mutant transcriptome profile and enhancement of recombinant protein release - Ji-Su Jun1,2, Soo Ji Kang3, Kwang-Won Hong1,*
-
Journal of Microbiology 2025;63(5):e2411032.
DOI: https://doi.org/10.71150/jm.2411032
Published online: May 27, 2025
1Department of Food Science and Biotechnology, Dongguk University-Seoul, Goyang-si 10326, Republic of Korea
2Synthetic Biology Research Center, Korea Research Institute of Bioscience and Biotechnology (KRIBB), Daejeon, 34141, Republic of Korea
3Korean Collection for Type Cultures (KCTC), Biological Resource Center, Korea Research Institute of Bioscience and Biotechnology (KRIBB), Jeongeup 56212, Republic of Korea
- *Correspondence Kwang-Won Hong hkwon@dongguk.edu
© The Microbiological Society of Korea
This is an Open Access article distributed under the terms of the Creative Commons Attribution Non-Commercial License (http://creativecommons.org/licenses/by-nc/4.0) which permits unrestricted non-commercial use, distribution, and reproduction in any medium, provided the original work is properly cited.
ABSTRACT
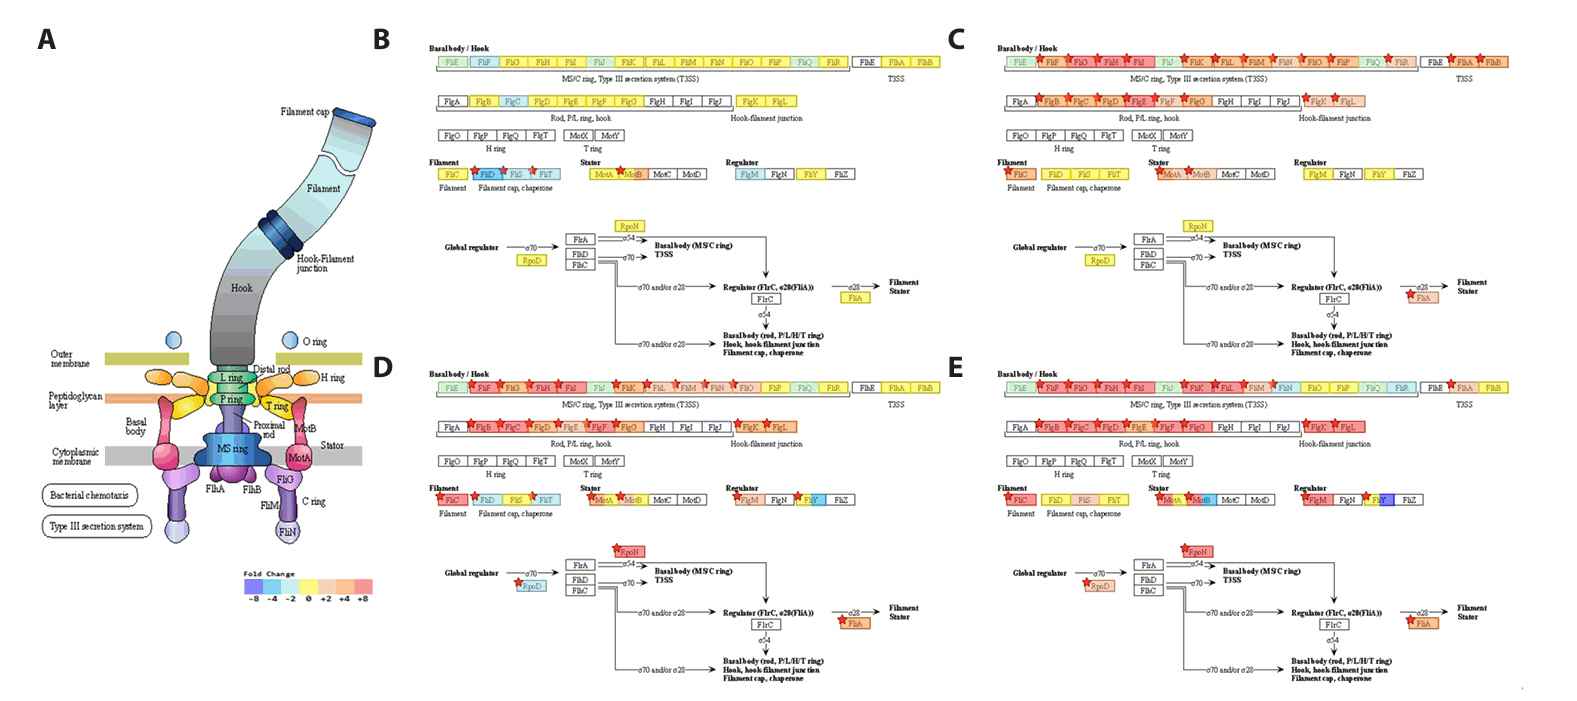
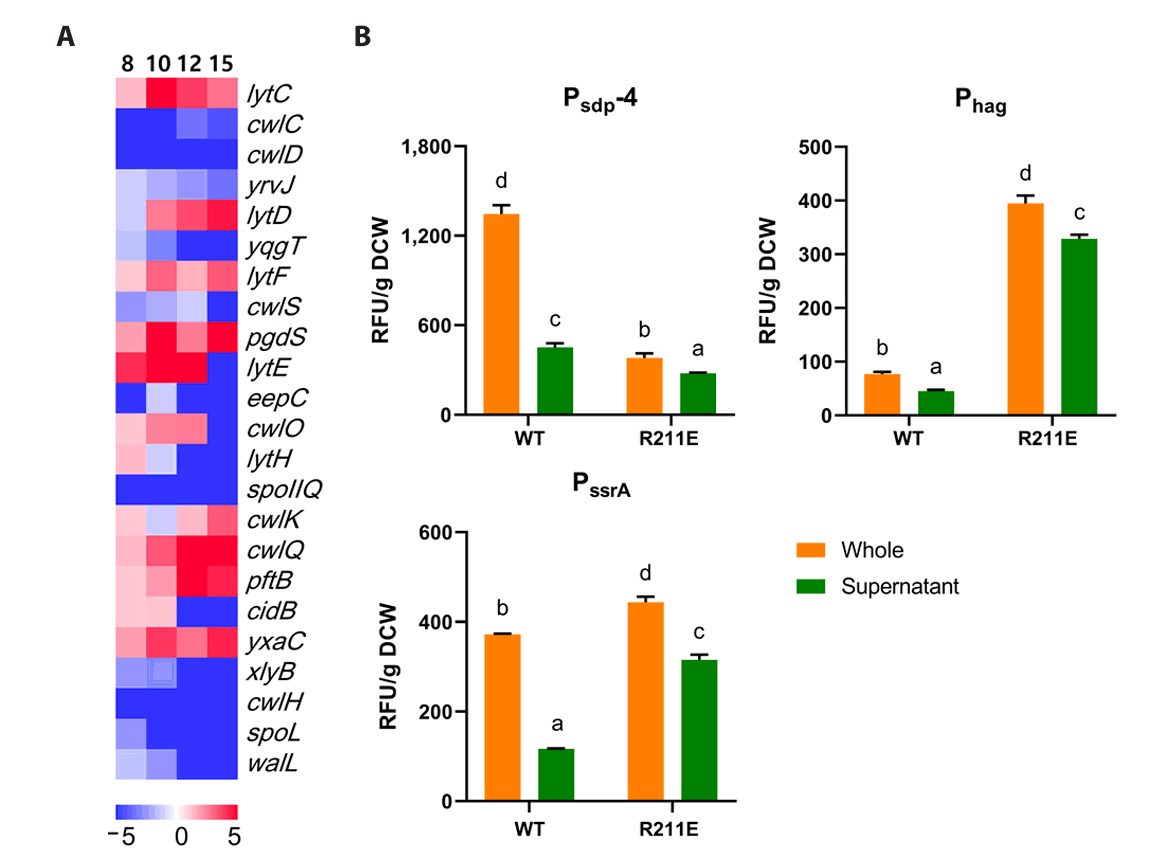
- Spo0A, the master regulator of sporulation initiation in Bacillus subtilis, controls over 500 genes directly or indirectly in early sporulation stages. Although the effects of Spo0A disruption on sporulation have been extensively studied, a comprehensive understanding of the genomic response throughout growth phases remain elusive. Here, we examined the transcriptomic changes in Spo0A mutant strain, R211E, and wild-type across a time-course RNA-seq to identify impacted biological processes and pathways. The R211E strain, which exhibits sporulation deficiency, was constructed using the clustered regularly interspaced short palindromic repeats (CRISPR)-CRISPR associated protein (Cas)9 system, highlighting the critical role of proper Cas9 dosing in gene editing. Functional analysis of 3,010 differentially expressed genes (DEGs) showed significant alterations in sporulation, quorum sensing, metabolism, and biofilm formation. The R211E disrupted the Spo0A-AbrB regulatory pathway, reducing biofilm formation and enhancing flagellar gene expression. Up-regulated metabolic pathways, including glycolysis, histidine, and purine biosynthesis, increased cell numbers during vegetative growth. Further, the mutant displayed elevated vegetative autolysin expression, resulting in reduced cell viability in the stationary phase. We also introduce the novel potential of R211E in a recombinant protein expression system that facilitated protein release into the supernatant, providing valuable insight for future research in metabolic engineering and efficient production systems in B. subtilis.
Introduction
Materials and Methods
Results
Discussion
Acknowledgments
Not applicable.
Author Contributions
Conceptualization, J.-S.J. and K.-W.H.; data curation, J.-S.J. and K.-W.H.; formal analysis, J.-S.J. and S.-J.K.; investigation, J.-S.J. and S.-J.K.; writing—original draft, J.-S.J.; writing—review and editing, J.-S.J. and K.-W.H. All authors have read and agreed to the published version of the manuscript.
Conflict of Interest
The authors declare no conflict to interest.
Funding
This study was financially supported by the National Research Foundation Korea (NRF-2021R1I1A2046284). Following are results of a study on the "Leaders in INdustry-university Cooperation 3.0" Project, supported by the Ministry of Education and National Research Foundation of Korea.
Data Availability Statement
The datasets supporting the conclusions of this article are included within the article as well as their additional files. The raw sequence data have been submitted to the Sequence Read Archive (SRA, https://www.ncbi.nlm.nih.gov/sra) under Bioproject accession number PRJNA1162568 and reference Biosample accession number SAMN43816647—50.
Supplementary Information
Table S2.
Fig. S1.
Fig. S3.
Fig. S4.


| Strains and plasmids | Description | Resource |
|---|---|---|
| Strains | ||
| E. coli DH5α | F- Φ80lacZΔM15 Δ(lacZYA-argF) U169 deoR recA1 endA1 hsdR17 (rK-, mK+) phoA supE44 λ- thi-1 gyrA96 relA1 | Hanahan (1983) |
| B. subtilis | ||
| DB104 (WT) | his nprR2 nprE18 ΔaprA3 | Kawamura and Doi (1984) |
| DB104 Spo0A R211E (R211E) | DB104 with mutation of spo0A R211E (CGT → GAA) | This study |
| Plasmids | ||
| pUB19 | E. coli-Bacillus shuttle vector, Apr, Kmr | Kang et al. (2019) |
| pCas9 | Bacterial expression of Cas9 nuclease, tracrRNA and crRNA guide, pACYC184 backbone, Cmr | addgene#42876 |
| pPamyE-Cas9 | Derivative of pCas9, replaced with PamyE | This study |
| pPamyE-Cas90A | Derivative of pPamyE -Cas9, includes 20 bp sgRNA targeting spo0A | This study |
| pUB19-Cas90A | Derivative of pPamyE -Cas90A; includes tracrRNA, Cas9, and crRNA; 20 bp sgRNA targeting spo0A | This study |
| pUB19L-Cas90A | pUB19-Cas90A derivative, converted to a low-copy-number origin (repB) | This study |
| pUC19 | E. coli vector, Apr | Lab collection |
| pUC19-R0A | pUC19 derivative, containing 430 bp donor DNA for generating spo0A mutation | This study |
| pUB19-Psdp-egfp-2 | Psdp-2 expression cassette, eGFP, Apr, Kmr | Jun et al. (2023a) |
| pUB19-Psdp-egfp-4 | Psdp-4 expression cassette, eGFP, Apr, Kmr | Jun et al. (2023a) |
| pUB19-Phag-egfp | hag promoter, eGFP, Apr, Kmr | This study |
| pUB19-PssrA-egfp | ssrA promoter, eGFP, Apr, Kmr | This study |
| Locus tag | Gene | Description | Fold change | Adj. p-vala | Comparison type |
|---|---|---|---|---|---|
| BSU_34870 | hisF | Imidazole glycerol phosphate synthase subunit | 3220.74 | 1.22 × 10 −205 | R211E, 10 h / 8 h |
| BSU_34920 | hisG | ATP phosphoribosyltransferase | 1823.43 | 1.65 × 10 −175 | R211E, 10 h / 8 h |
| BSU_34900 | hisB | Imidazoleglycerol-phosphate dehydratase | 1319.59 | 1.38 × 10 −176 | R211E, 10 h / 8 h |
| BSU_34860 | hisI | Bifunctional phosphoribosyl-AMP cyclohydrolase | 1313.22 | 3.48 × 10 −203 | R211E, 10 h / 8 h |
| BSU_34890 | hisH | Imidazole glycerol phosphate synthase | 1289.17 | 2.12 × 10 −186 | R211E, 10 h / 8 h |
| BSU_34910 | hisD | Histidinol dehydrogenase | 1103.91 | 5.63 × 10 −191 | R211E, 10 h / 8 h |
| BSU_34880 | hisA | Phosphoribosylformimino-5-aminoimidazole carboxamide ribotide isomerase | 948.15 | 1.81 × 10 −173 | R211E, 10 h / 8 h |
| BSU_34930 | hisZ | Histidyl-tRNA synthetase | 922.49 | 5.68 × 10 −169 | R211E, 10 h / 8 h |
| BSU_17450 | glnR | Transcriptional regulator | 536.98 | 2.03 × 10 −41 | R211E/WT, 15 h |
| BSU_22200 | cotD | Spore coat protein | 291.36 | 1.27 × 10 −41 | WT, 15 h / 12 h |
| BSU_11750 | cotY | Outer spore coat protein | −137476.94 | 8.41 × 10 −27 | R211E/WT, 15 h |
| BSU_11740 | cotZ | Spore coat protein | −90494.67 | 6.03 × 10 −26 | R211E/WT, 15 h |
| BSU_09750 | sspB | Small acid-soluble spore protein | −30569.08 | 5.17 × 10 −24 | R211E/WT, 15 h |
| BSU_09750 | sspB | Small acid-soluble spore protein | −17694.34 | 1.38 × 10 −30 | R211E/WT, 15 h |
| BSU_06910 | cotJC | Enzyme component of the inner spore coat | −16731.66 | 3.80 × 10 −42 | R211E/WT, 15 h |
| BSU_40530 | cotF | Spore coat protein | −14976.10 | 2.11 × 10 −20 | R211E/WT, 15 h |
| BSU_misc_RNA_86 | srlX | Putative small RNA or mRNA leader sequence | −10554.53 | 1.14 × 10 −14 | R211E/WT, 8 h |
| BSU_39890 | yxbB | Putative S-adenosylmethionine-dependent methyltransferase | −7381.12 | 1.23 × 10 −11 | R211E/WT, 8 h |
| BSU_11760 | cotX | Spore coat protein | −7204.75 | 2.76 × 10 −25 | R211E/WT, 15 h |
| BSU_28410 | gerE | Transcriptional regulator of SigK-dependent late spore coat genes | −5941.51 | 6.68 × 10 −21 | R211E/WT, 15 h |
- Anju S, Aparna Y, Bhima B, Sarada J. 2018. Novel insights on the Bacillus quorum sensing mechanism: Its role in competence, virulence, sporulation and biofilm formation. In Bramhachari PV. (ed.), Implication of Quorum Sensing System in Biofilm Formation and Virulence, pp. 313–327, Springer.Article
- Anjum A, Jaggi S, Varghese E, Lall S, Bhowmik A, et al. 2016. Identification of differentially expressed genes in RNA-seq data of Arabidopsis thaliana : A compound distribution approach. J Comput Biol. 23(4): 239–247. ArticlePubMedPMC
- Beetham CM, Schuster CF, Kviatkovski I, Santiago M, Walker S, et al. 2024. Histidine transport is essential for the growth of Staphylococcus aureus at low pH. PLoS Pathog. 20(1): e1011927. ArticlePubMedPMC
- Benyoussef W, Deforet M, Monmeyran A, Henry N. 2022. Flagellar motility during E. coli biofilm formation provides a competitive disadvantage which recedes in the presence of co-colonizers. Front Cell Infect Microbiol. 12: 896898.ArticlePubMedPMC
- Colin R, Ni B, Laganenka L, Sourjik V. 2021. Multiple functions of flagellar motility and chemotaxis in bacterial physiology. FEMS Microbiol Rev. 45(6): fuab038.ArticlePubMedPMCPDF
- Dietl AM, Amich J, Leal S, Beckmann N, Binder U, et al. 2016. Histidine biosynthesis plays a crucial role in metal homeostasis and virulence of Aspergillus fumigatus . Virulence. 7(4): 465–476. ArticlePubMedPMCLink
- Eswaramoorthy P, Fujita M. 2010. Systematic domain deletion analysis of the major sporulation kinase in Bacillus subtilis. J Bacteriol. 192(6): 1744–1748. ArticlePubMedPMCLink
- Fawcett P, Eichenberger P, Losick R, Youngman P. 2000. The transcriptional profile of early to middle sporulation in Bacillus subtilis. Proc Natl Acad Sci USA. 97(14): 8063–8068. ArticlePubMedPMC
- Ferrari E, Howard S, Hoch J. 1986. Effect of stage 0 sporulation mutations on subtilisin expression. J Bacteriol. 166(1): 173–179. ArticlePubMedPMCLink
- Fishman L, Modak A, Nechooshtan G, Razin T, Erhard F, et al. 2024. Cell-type-specific mRNA transcription and degradation kinetics in zebrafish embryogenesis from metabolically labeled single-cell RNA-seq. Nat Commun. 15(1): 3104.ArticlePubMedPMCPDF
- Froger A, Hall JE. 2007. Transformation of plasmid DNA into E. coli using the heat shock method. J Vis Exp. (6): e253. Article
- Fujita M, Losick R. 2005. Evidence that entry into sporulation in Bacillus subtilis is governed by a gradual increase in the level and activity of the master regulator Spo0A. Genes Dev. 19(18): 2236–2244. ArticlePubMedPMC
- Gibert I, Casadesús J. 1990. sulA-independent division inhibition in His-constitutive strains of Salmonella typhimurium. FEMS Microbiol Lett. 69(3): 205–210. Article
- Grimsley JK, Tjalkens RB, Strauch MA, Bird TH, Spiegelman GB, et al. 1994. Subunit composition and domain structure of the Spo0A sporulation transcription factor of Bacillus subtilis. J Biol Chem. 269(24): 16977–16982. ArticlePubMed
- Hamon MA, Lazazzera BA. 2001. The sporulation transcription factor Spo0A is required for biofilm development in Bacillus subtilis. Mol Microbiol. 42(5): 1199–1209. ArticlePubMed
- Hamon MA, Stanley NR, Britton RA, Grossman AD, Lazazzera BA. 2004. Identification of AbrB-regulated genes involved in biofilm formation by Bacillus subtilis. Mol Microbiol. 52(3): 847–860. ArticlePubMedPMC
- Hanahan D. 1983. Studies on transformation of Escherichia coli with plasmids. J Mol Biol. 166(4): 557–580. ArticlePubMed
- Hatt JK, Youngman P. 1998. Spo0A mutants of Bacillus subtilis with sigma factor-specific defects in transcription activation. J Bacteriol. 180(14): 3584–3591. ArticlePubMedPMCLink
- Horsburgh GJ, Atrih A, Foster SJ. 2003. Characterization of LytH, a differentiation-associated peptidoglycan hydrolase of Bacillus subtilis involved in endospore cortex maturation. J Bacteriol. 185(13): 3813–3820. ArticlePubMedPMCLink
- Hou X, Yu X, Du B, Liu K, Yao L, et al. 2016. A single amino acid mutation in Spo0A results in sporulation deficiency of Paenibacillus polymyxa SC2. Res Microbiol. 167(6): 472–479. ArticlePubMed
- Ireton K, Gunther 4th N, Grossman AD. 1994. spo0J is required for normal chromosome segregation as well as the initiation of sporulation in Bacillus subtilis. J Bacteriol. 176(17): 5320–5329. ArticlePubMedPMCLink
- Jiang M, Shao W, Perego M, Hoch JA. 2000. Multiple histidine kinases regulate entry into stationary phase and sporulation in Bacillus subtilis. Mol Microbiol. 38(3): 535–542. ArticlePubMed
- Jun JS, Jeong HE, Hong KW. 2023a. Exploring and engineering novel strong promoters for high-level protein expression in Bacillus subtilis DB104 through transcriptome analysis. Microorganisms. 11(12): 2929.ArticlePubMedPMC
- Jun JS, Jeong HE, Moon SY, Shin SH, Hong KW. 2023b. Time-course transcriptome analysis of Bacillus subtilis DB104 during growth. Microorganisms. 11(8): 1928.ArticlePubMedPMC
- Kang SJ, Park EA, Lee DH, Hong KW. 2019. Comparison of the stability of eGFP displayed on the Bacillus subtilis spore surface using CotB and C-terminally truncated CotB proteins as an anchoring motif under extreme conditions. Appl Biol Chem. 62(1): 1–8. ArticlePDF
- Kawamura F, Doi RH. 1984. Construction of a Bacillus subtilis double mutant deficient in extracellular alkaline and neutral proteases. J Bacteriol. 160(1): 442–444. ArticlePubMedPMCLink
- Keggins KM, Lovett PS, Duvall EJ. 1978. Molecular cloning of genetically active fragments of Bacillus DNA in Bacillus subtilis and properties of the vector plasmid pUB110. Proc Natl Acad Sci USA. 75(3): 1423–1427. ArticlePubMedPMC
- Kobayashi K. 2007. Gradual activation of the response regulator DegU controls serial expression of genes for flagellum formation and biofilm formation in Bacillus subtilis. Mol Microbiol. 66(2): 395–409. ArticlePubMedLink
- Kobayashi K, Ogasawara N. 2002. Genome biology of a model bacterium, Bacillus subtilis. Int Congr Ser. 1246: 15–25. Article
- Kodama T, Endo K, Ara K, Ozaki K, Kakeshita H, et al. 2007. Effect of Bacillus subtilis spo0A mutation on cell wall lytic enzymes and extracellular proteases, and prevention of cell lysis. J Biosci Bioeng. 103(1): 13–21. ArticlePubMed
- Koebmann BJ, Westerhoff HV, Snoep JL, Nilsson D, Jensen PR. 2002. The glycolytic flux in Escherichia coli is controlled by the demand for ATP. J Bacteriol. 184(14): 3909–3916. ArticlePubMedPMCLink
- Kogenaru S, Yan Q, Guo Y, Wang N. 2012. RNA-seq and microarray complement each other in transcriptome profiling. BMC Genomics. 13: 629.ArticlePubMedPMCPDF
- Kumar A, Singh TR. 2013. A quantitative study of gene regulatory pathways in Bacillus subtilis for virulence and competence phenotype by quorum sensing. Syst Synth Biol. 7: 33–39. ArticlePubMedPMCPDF
- Kuroda A, Asami Y, Sekiguchi J. 1993. Molecular cloning of a sporulation-specific cell wall hydrolase gene of Bacillus subtilis. J Bacteriol. 175(19): 6260–6268. ArticlePubMedPMCLink
- Kuroda A, Sekiguchi J. 1991. Molecular cloning and sequencing of a major Bacillus subtilis autolysin gene. J Bacteriol. 173(22): 7304–7312. ArticlePubMedPMCLink
- Labun K, Montague TG, Krause M, Torres Cleuren YN, Tjeldnes H, et al. 2019. CHOPCHOP v3: expanding the CRISPR web toolbox beyond genome editing. Nucleic Acids Res. 47(W1): W171–W174. ArticlePubMedPMCPDF
- Lemon KP, Higgins DE, Kolter R. 2007. Flagellar motility is critical for Listeria monocytogenes biofilm formation. J Bacteriol. 189(12): 4418–4424. ArticlePubMedPMCLink
- Leonhardt H. 1990. Identification of a low-copy-number mutation within the pUB110 replicon and its effect on plasmid stability in Bacillus subtilis. Gene. 94(1): 121–124. ArticlePubMed
- Livak KJ, Schmittgen TD. 2001. Analysis of relative gene expression data using real-time quantitative PCR and the 2− ΔΔCT method. Methods. 25(4): 402–408. ArticlePubMed
- Londoño-Vallejo JA, Frehel C, Stragier P. 1997. SpoIIQ, a forespore-expressed gene required for engulfment in Bacillus subtilis. Mol Microbiol. 24(1): 29–39. ArticlePubMedLink
- Lu Q, Pan K, Liu J, Zhang T, Yang L, et al. 2023. Quorum sensing system effectively enhances DegU-mediated degradation of pyrethroids by Bacillus subtilis. J Hazard Mater. 455: 131586.ArticlePubMed
- Maere S, Heymans K, Kuiper M. 2005. BiNGO: a Cytoscape plugin to assess overrepresentation of gene ontology categories in biological networks. Bioinformatics. 21(16): 3448–3449. ArticlePubMed
- Mantione KJ, Kream RM, Kuzelova H, Ptacek R, Raboch J, et al. 2014. Comparing bioinformatic gene expression profiling methods: microarray and RNA-Seq. Med Sci Monit Basic Res. 20: 138.ArticlePubMedPMC
- Marathe A, Zarazúa-Osorio B, Srivastava P, Fujita M. 2023. The master regulator for entry into sporulation in Bacillus subtilis becomes a mother cell-specific transcription factor for forespore engulfment. Mol Microbiol. 120(3): 439–461. ArticlePubMedLink
- Margot P, Mauël C, Karamata D. 1994. The gene of the N-acetylglucosaminidase, a Bacillus subtilis 168 cell wall hydrolase not involved in vegetative cell autolysis. Mol Microbiol. 12(4): 535–545. ArticlePubMed
- Margot P, Wahlen M, Gholamhuseinian A, Piggot P, Karamata D. 1998. The lytE gene of Bacillus subtilis 168 encodes a cell wall hydrolase. J Bacteriol. 180(3): 749–752. ArticlePubMedPMCLink
- McKenney PT, Driks A, Eichenberger P. 2013. The Bacillus subtilis endospore: assembly and functions of the multilayered coat. Nat Rev Microbiol. 11(1): 33–44. ArticlePubMedPMCPDF
- Monahan LG, Hajduk IV, Blaber SP, Charles IG, Harry EJ. 2014. Coordinating bacterial cell division with nutrient availability: a role for glycolysis. MBio. 5(3): e00935–14. ArticlePubMedPMCLink
- Ohnishi R, Ishikawa S, Sekiguchi J. 1999. Peptidoglycan hydrolase LytF plays a role in cell separation with CwlF during vegetative growth of Bacillus subtilis. J Bacteriol. 181(10): 3178–3184. ArticlePubMedPMCLink
- Pedrido ME, de Oña P, Ramirez W, Leñini C, Goñi A, et al. 2013. Spo0A links de novo fatty acid synthesis to sporulation and biofilm development in Bacillus subtilis. Mol Microbiol. 87(2): 348–367. ArticlePubMed
- Perego M, Cole SP, Burbulys D, Trach K, Hoch JA. 1989. Characterization of the gene for a protein kinase which phosphorylates the sporulation-regulatory proteins Spo0A and Spo0F of Bacillus subtilis. J Bacteriol. 171(11): 6187–6196. ArticlePubMedPMCLink
- Piazza F, Tortosa P, Dubnau D. 1999. Mutational analysis and membrane topology of ComP, a quorum-sensing histidine kinase of Bacillus subtilis controlling competence development. J Bacteriol. 181(15): 4540–4548. ArticlePubMedPMCLink
- Robinson MD, McCarthy DJ, Smyth GK. 2010. edgeR: a Bioconductor package for differential expression analysis of digital gene expression data. Bioinformatics. 26(1): 139–140. ArticlePubMed
- Robinson MD, Oshlack A. 2010. A scaling normalization method for differential expression analysis of RNA-seq data. Genome Biol. 11: 1–9. ArticlePubMedPMCPDF
- Schultz D, Wolynes PG, Jacob EB, Onuchic JN. 2009. Deciding fate in adverse times: sporulation and competence in Bacillus subtilis. Proc Natl Acad Sci USA. 106(50): 21027–21034. ArticlePubMedPMC
- Sekiguchi J, Akeo K, Yamamoto H, Khasanov FK, Alonso JC, et al. 1995. Nucleotide sequence and regulation of a new putative cell wall hydrolase gene, cwlD, which affects germination in Bacillus subtilis. J Bacteriol. 177(19): 5582–5589. ArticlePubMedPMCLink
- Setlow P. 2006. Spores of Bacillus subtilis: their resistance to and killing by radiation, heat and chemicals. J Appl Microbiol. 101(3): 514–525. ArticlePubMed
- Smith TJ, Foster SJ. 1995. Characterization of the involvement of two compensatory autolysins in mother cell lysis during sporulation of Bacillus subtilis 168. J Bacteriol. 177(13): 3855–3862. ArticlePubMedPMCLink
- So Y, Park SY, Park EH, Park SH, Kim EJ, et al. 2017. A highly efficient CRISPR-Cas9-mediated large genomic deletion in Bacillus subtilis. Front Microbiol. 8: 1167.ArticlePubMedPMC
- Solomon JM, Magnuson R, Srivastava A, Grossman AD. 1995. Convergent sensing pathways mediate response to two extracellular competence factors in Bacillus subtilis. Genes Dev. 9(5): 547–558. ArticlePubMed
- Soonsanga S, Luxananil P, Promdonkoy B. 2020. Modulation of Cas9 level for efficient CRISPR-Cas9-mediated chromosomal and plasmid gene deletion in Bacillus thuringiensis. Biotechnol Lett. 42: 625–632. ArticlePubMedPDF
- Steil L, Serrano M, Henriques AO, Volker U. 2005. Genome-wide analysis of temporally regulated and compartment-specific gene expression in sporulating cells of Bacillus subtilis. Microbiology. 151(2): 399–420. ArticlePubMed
- Stephenson K, Bron S, Harwood C. 1999. Cellular lysis in Bacillus subtilis; the affect of multiple extracellular protease deficiencies. Lett Appl Microbiol. 29(2): 141–145. Article
- Strauch M, Webb V, Spiegelman G, Hoch JA. 1990. The SpoOA protein of Bacillus subtilis is a repressor of the abrB gene. Proc Natl Acad Sci USA. 87(5): 1801–1805. ArticlePubMedPMC
- Tasan I, Zhao H. 2017. Targeting specificity of the CRISPR/Cas9 system. ACS Synth. Biol. 6(9): 1609–1613. ArticlePubMed
- Valdés-Hernández J, Ramayo-Caldas Y, Passols M, Sebastià C, Criado-Mesas L, et al. 2023. Global analysis of the association between pig muscle fatty acid composition and gene expression using RNA-Seq. Sci Rep. 13(1): 535.ArticlePubMedPMC
- van Leeuwe TM, Arentshorst M, Ernst T, Alazi E, Punt PJ, et al. 2019. Efficient marker free CRISPR/Cas9 genome editing for functional analysis of gene families in filamentous fungi. Fungal Biol Biotechnol. 6: 13.ArticlePubMedPMC
- Van Sinderen D, Venema G. 1994. comK acts as an autoregulatory control switch in the signal transduction route to competence in Bacillus subtilis. J Bacteriol. 176(18): 5762–5770. ArticlePubMedPMCLink
- Vlamakis H, Aguilar C, Losick R, Kolter R. 2008. Control of cell fate by the formation of an architecturally complex bacterial community. Genes Dev. 22(7): 945–953. ArticlePubMedPMC
- Vojcic L, Despotovic D, Martinez R, Maurer KH, Schwaneberg U. 2012. An efficient transformation method for Bacillus subtilis DB104. Appl Microbiol Biotechnol. 94: 487–493. ArticlePubMedPDF
- Wang L, Perpich J, Driks A, Kroos L. 2007. Maintaining the transcription factor SpoIIID level late during sporulation causes spore defects in Bacillus subtilis. J Bacteriol. 189(20): 7302–7309. ArticlePubMedPMCLink
- Wang M, Yu H, Li X, Shen Z. 2020. Single-gene regulated non-spore-forming Bacillus subtilis: Construction, transcriptome responses, and applications for producing enzymes and surfactin. Metab Eng. 62: 235–248. ArticlePubMed
- Watnick PI, Lauriano CM, Klose KE, Croal L, Kolter R. 2001. The absence of a flagellum leads to altered colony morphology, biofilm development and virulence in Vibrio cholerae O139. Mol Microbiol. 39(2): 223–235. ArticlePubMedPMC
- Yamamoto H, Kurosawa Si, Sekiguchi J. 2003. Localization of the vegetative cell wall hydrolases LytC, LytE, and LytF on the Bacillus subtilis cell surface and stability of these enzymes to cell wall-bound or extracellular proteases. J Bacteriol. 185(22): 6666–6677. ArticlePubMedPMCLink
- Yu H, Guo Q, Ji W, Wang H, Tao J, et al. 2024. Transcriptome expression profiling reveals the molecular response to salt stress in Gossypium anomalum seedlings. Plants. 13(2): 312.ArticlePubMedPMC
- Zhang K, Su L, Wu J. 2020. Recent advances in recombinant protein production by Bacillus subtilis. Annu Rev Food Sci Technol. 11(1): 295–318. ArticlePubMed
- Zhang F, Wen Y, Guo X. 2014. CRISPR/Cas9 for genome editing: progress, implications and challenges. Hum Mol Genet. 23(R1): R40–R46. ArticlePubMed
- Zhao H, Msadek T, Zapf J, Hoch JA, Varughese KI. 2002. DNA complexed structure of the key transcription factor initiating development in sporulating bacteria. Structure. 10(8): 1041–1050. ArticlePubMed
- Zhou Y, Song F, Yang H, Li D, Zhang N, et al. 2023. Construction of a food-grade gene editing system based on CRISPR-Cas9 and its application in Lactococcus lactis NZ9000. Biotechnol Lett. 45(8): 955–966. ArticlePubMedPDF
- Zhou C, Zhou H, Zhang H, Lu F. 2019. Optimization of alkaline protease production by rational deletion of sporulation related genes in Bacillus licheniformis. Microb Cell Fact. 18: 1–12. ArticlePubMedPMCPDF
References
Supplementary Information
References
Citations
- Novel Regulatory Interplay between FtsH and Spo0A∼P in Bacillus cereus 0–9 Biofilm Formation: A Potential Target for Antibiofilm Strategies
Xingwang Han, Pengfei Wang, Hao Zhang, Haodong Wang, Fengying Liu, Yange Fan, Xi Xiong, Juanmei Zhang, Gang Wang
Journal of Agricultural and Food Chemistry.2026;[Epub] CrossRef - Transcriptome-Guided Analysis and Application of the Mechanisms Influencing PamyE Promoter Activity
Jiejie Guo, Weihong Wang, Yifan Tong, Dengke Li, Weixia Gao, Yu Li, Fuping Lu
Journal of Agricultural and Food Chemistry.2025; 73(51): 32637. CrossRef
 ePub Link
 Cite this Article
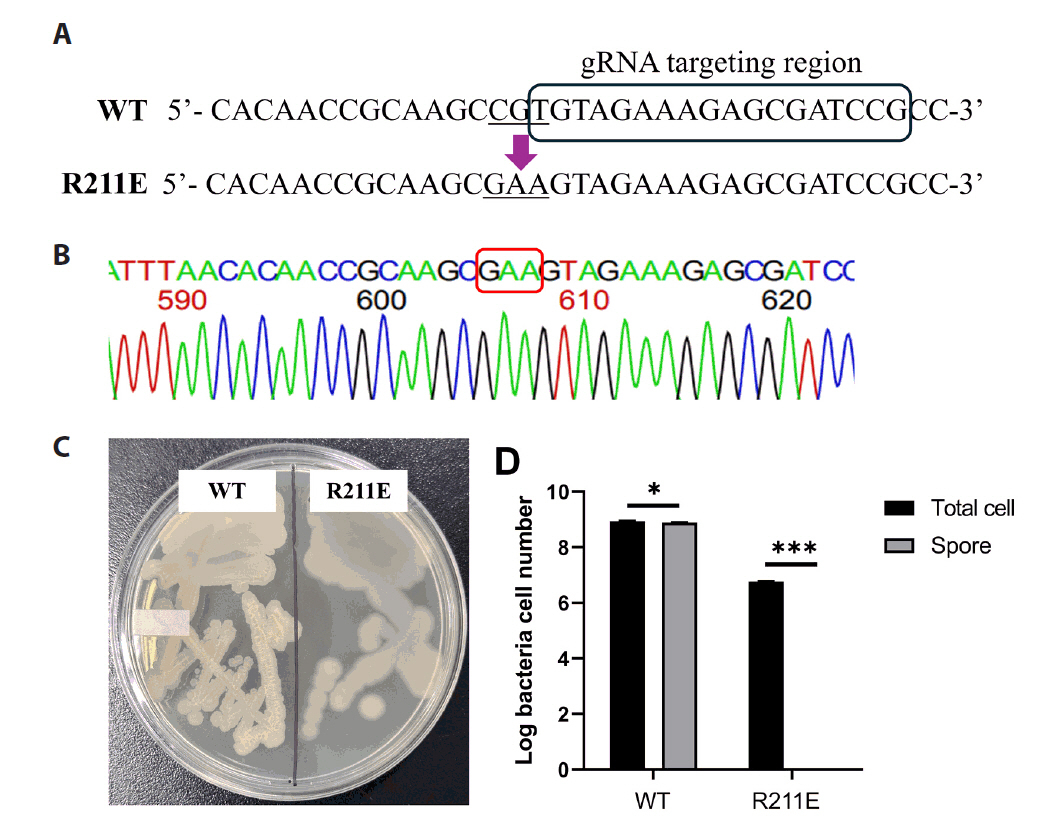


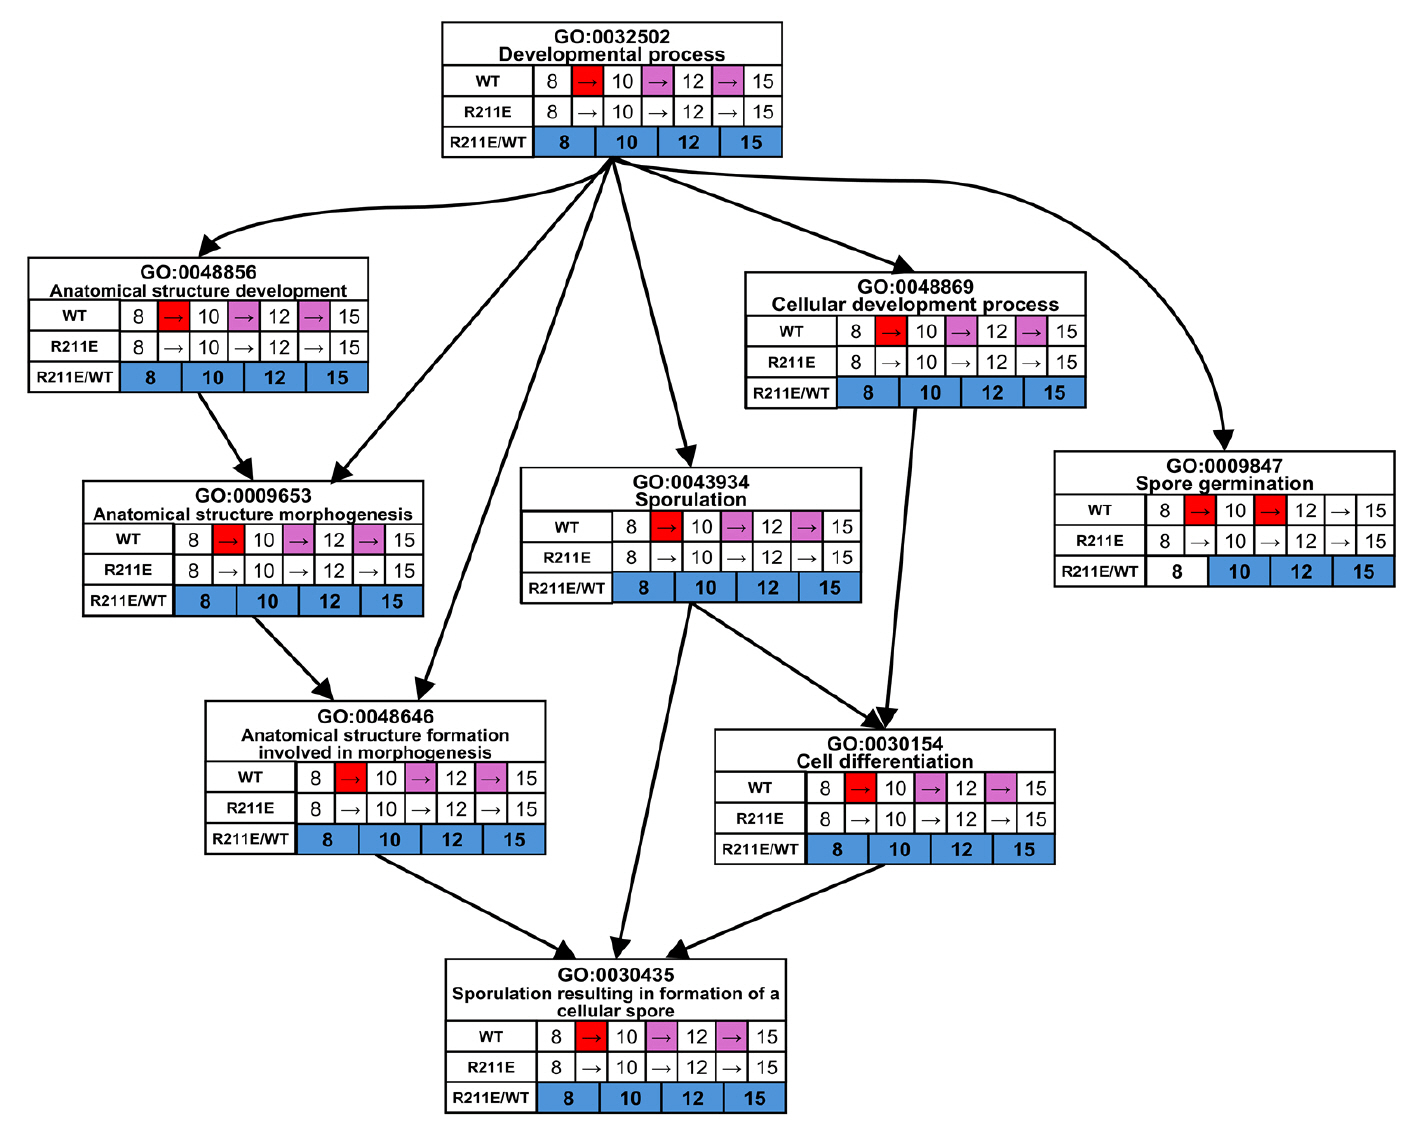


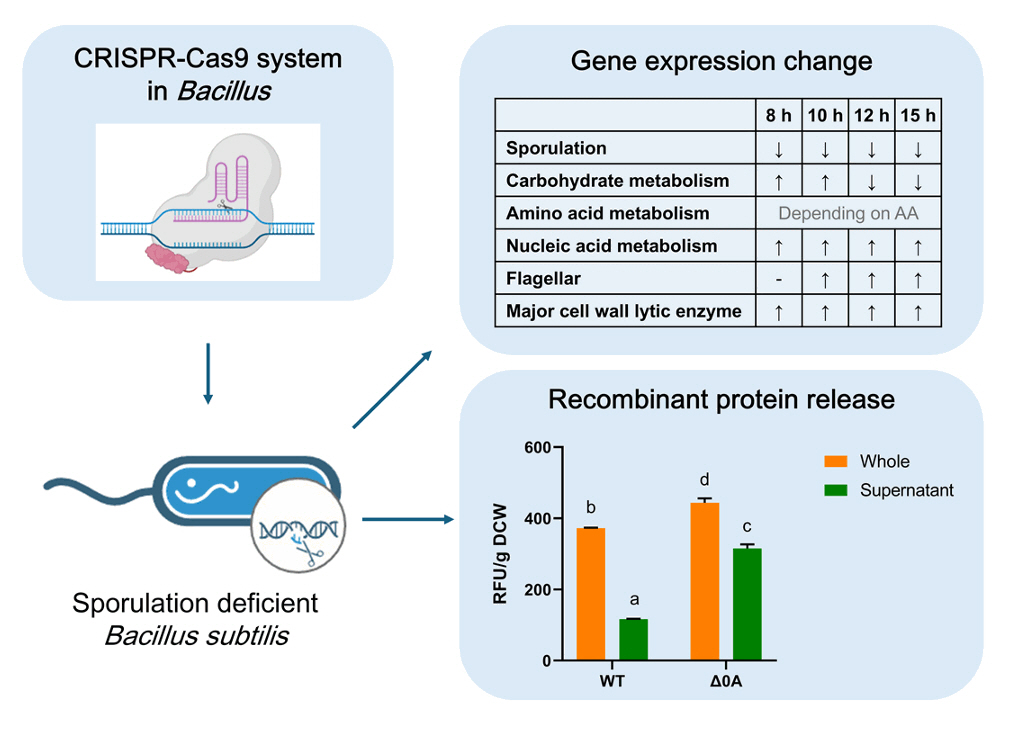


Fig. 1.
Fig. 2.
Fig. 3.
Fig. 4.
Fig. 5.
Fig. 6.
Fig. 7.
Fig. 8.
Fig. 9.
| Strains and plasmids | Description | Resource |
|---|---|---|
| Strains | ||
| E. coli DH5α | F- Φ80lacZΔM15 Δ(lacZYA-argF) U169 deoR recA1 endA1 hsdR17 (rK-, mK+) phoA supE44 λ- thi-1 gyrA96 relA1 | |
| B. subtilis | ||
| DB104 (WT) | his nprR2 nprE18 ΔaprA3 | |
| DB104 Spo0A R211E (R211E) | DB104 with mutation of spo0A R211E (CGT → GAA) | This study |
| Plasmids | ||
| pUB19 | E. coli-Bacillus shuttle vector, Ap |
|
| pCas9 | Bacterial expression of Cas9 nuclease, tracrRNA and crRNA guide, pACYC184 backbone, Cm |
addgene#42876 |
| pPamyE-Cas9 | Derivative of pCas9, replaced with PamyE | This study |
| pPamyE-Cas90A | Derivative of pPamyE -Cas9, includes 20 bp sgRNA targeting spo0A | This study |
| pUB19-Cas90A | Derivative of pPamyE -Cas90A; includes tracrRNA, Cas9, and crRNA; 20 bp sgRNA targeting spo0A | This study |
| pUB19L-Cas90A | pUB19-Cas90A derivative, converted to a low-copy-number origin (repB) | This study |
| pUC19 | E. coli vector, Ap |
Lab collection |
| pUC19-R0A | pUC19 derivative, containing 430 bp donor DNA for generating spo0A mutation | This study |
| pUB19-Psdp-egfp-2 | Psdp-2 expression cassette, eGFP, Ap |
|
| pUB19-Psdp-egfp-4 | Psdp-4 expression cassette, eGFP, Ap |
|
| pUB19-Phag-egfp | hag promoter, eGFP, Ap |
This study |
| pUB19-PssrA-egfp | ssrA promoter, eGFP, Ap |
This study |
| Locus tag | Gene | Description | Fold change | Adj. p-val |
Comparison type |
|---|---|---|---|---|---|
| BSU_34870 | hisF | Imidazole glycerol phosphate synthase subunit | 3220.74 | 1.22 × 10 −205 | R211E, 10 h / 8 h |
| BSU_34920 | hisG | ATP phosphoribosyltransferase | 1823.43 | 1.65 × 10 −175 | R211E, 10 h / 8 h |
| BSU_34900 | hisB | Imidazoleglycerol-phosphate dehydratase | 1319.59 | 1.38 × 10 −176 | R211E, 10 h / 8 h |
| BSU_34860 | hisI | Bifunctional phosphoribosyl-AMP cyclohydrolase | 1313.22 | 3.48 × 10 −203 | R211E, 10 h / 8 h |
| BSU_34890 | hisH | Imidazole glycerol phosphate synthase | 1289.17 | 2.12 × 10 −186 | R211E, 10 h / 8 h |
| BSU_34910 | hisD | Histidinol dehydrogenase | 1103.91 | 5.63 × 10 −191 | R211E, 10 h / 8 h |
| BSU_34880 | hisA | Phosphoribosylformimino-5-aminoimidazole carboxamide ribotide isomerase | 948.15 | 1.81 × 10 −173 | R211E, 10 h / 8 h |
| BSU_34930 | hisZ | Histidyl-tRNA synthetase | 922.49 | 5.68 × 10 −169 | R211E, 10 h / 8 h |
| BSU_17450 | glnR | Transcriptional regulator | 536.98 | 2.03 × 10 −41 | R211E/WT, 15 h |
| BSU_22200 | cotD | Spore coat protein | 291.36 | 1.27 × 10 −41 | WT, 15 h / 12 h |
| BSU_11750 | cotY | Outer spore coat protein | −137476.94 | 8.41 × 10 −27 | R211E/WT, 15 h |
| BSU_11740 | cotZ | Spore coat protein | −90494.67 | 6.03 × 10 −26 | R211E/WT, 15 h |
| BSU_09750 | sspB | Small acid-soluble spore protein | −30569.08 | 5.17 × 10 −24 | R211E/WT, 15 h |
| BSU_09750 | sspB | Small acid-soluble spore protein | −17694.34 | 1.38 × 10 −30 | R211E/WT, 15 h |
| BSU_06910 | cotJC | Enzyme component of the inner spore coat | −16731.66 | 3.80 × 10 −42 | R211E/WT, 15 h |
| BSU_40530 | cotF | Spore coat protein | −14976.10 | 2.11 × 10 −20 | R211E/WT, 15 h |
| BSU_misc_RNA_86 | srlX | Putative small RNA or mRNA leader sequence | −10554.53 | 1.14 × 10 −14 | R211E/WT, 8 h |
| BSU_39890 | yxbB | Putative S-adenosylmethionine-dependent methyltransferase | −7381.12 | 1.23 × 10 −11 | R211E/WT, 8 h |
| BSU_11760 | cotX | Spore coat protein | −7204.75 | 2.76 × 10 −25 | R211E/WT, 15 h |
| BSU_28410 | gerE | Transcriptional regulator of SigK-dependent late spore coat genes | −5941.51 | 6.68 × 10 −21 | R211E/WT, 15 h |
Ap: Ampicillin, Km: Kanamycin, Cm: Chloramphenicol, : resistance
Table 1.
Table 2.
TOP

