ABSTRACT
- This study aimed to determine if the microbiota in four different oral sites and the oral health status differ between patients with primary Sjögren’s syndrome (pSS), non-pSS sicca symptoms, and healthy controls. All participants underwent an interview and clinical oral examination. Stimulated whole saliva (SWS), supragingival plaque (SGP), buccal mucosa tissue (BLM), and tongue scrape (TGS) samples from 23 pSS patients, 36 patients with sicca symptoms, not fulfilling the classification criteria for pSS (non-pSS sicca), and 21 age-matched healthy controls (HC) were analyzed using V3–V4 16S rRNA gene amplicon sequencing, and determination of amplicon sequence variants (ASVs). PSS and non-pSS sicca patients did not differ with respect to oral health status, saliva flow rates, abundance of predominant genera, relative abundance on genus level or bacterial diversity in any of the oral sites. Both patient groups differed significantly from the healthy control group in the abundance of 61 ASVs across all sites. The alpha-diversity was lower in SGP from non-pSS sicca patients (p = 0.019), and in TGS from pSS patients (p = 0.04). The proportion of variation in the beta-diversity across all four sites could be explained by the diagnosis (pSS, non-pSS sicca, and HC). However, subgrouping of patients according to their stimulated salivary flow rates (SWS > 0.7 ml/min versus SWS ≤ 0.7 ml/min), revealed significantly different abundance of three ASVs in SWS, 11 in SGP, and six in TGS. Our findings suggest that hyposalivation rather than pSS itself modifies the microbial composition in oral site-specific patterns leading to oral diseases.
-
Keywords: primary Sjögren’s syndrome, oral microbiome, hyposalivation
Introduction
Primary Sjögren’s syndrome (pSS) is a chronic autoimmune disease characterized by focal lymphocytic infiltration of the exocrine glands, predominantly the salivary and lacrimal glands, resulting in glandular dysfunction and severe oral and ocular dryness. A large variety of extraglandular manifestations including fatigue, myalgia, arthralgia, central and sensory peripheral neuropathy may also be observed (Brito-Zerón et al., 2016). The processes underlying the humoral and cellular autoimmune reactions observed in pSS, remain unclear. The etiology is unknown but considered multifactorial, involving an interplay of genetic predisposition, environmental factors, and epigenetic factors (Mariette and Criswell, 2018; Thorlacius et al., 2023). Among patients, the female-to-male ratio is 9:1, the incidence peaks around 40–50 years of age, and the global estimated prevalence ranges between 0.01% and 0.72% (Brito-Zerón et al., 2016).
Saliva is essential to maintain oral health. It provides antimicrobial activity via a large variety of proteins and peptides, neutralizes acids from food and bacteria via salivary buffering systems, contributes to the formation of the dental and mucosal pellicle, dilutes food detritus and bacteria, and it mechanically cleanses the oral cavity, and constantly covers and lubricates the oral mucosa, thereby enhancing the mucosal barrier function and a balanced oral microbiota (Dawes et al., 2015; Lynge Pedersen and Belstrøm, 2019). Salivary gland hypofunction can lead to oral microbial dysbiosis due to impaired oral clearance, impaired salivary buffer capacity and altered salivary composition, and consequently an increased risk of developing oral diseases. Thus, patients with pSS have a higher risk of developing dental caries and oral candidiasis (Pedersen et al., 2005; Yan et al., 2011).
During the last decade, emerging evidence suggests that imbalances in the complex interaction between the microbiota, particularly the gut microbiome, and host immune system, resulting in dysbiosis and deregulation of the immune response, contribute to the pathogenesis of a multitude of chronic immune-mediated diseases (Fujiwara et al., 2020). It has been demonstrated that patients with Sjögren’s syndrome (SS) present gut microbial dysbiosis, which is also related to disease severity (Mandl et al., 2017; Mendez et al., 2020; Moon et al., 2020). In addition, rheumatic arthritis, systemic sclerosis, and lupus erythematosus display gut dysbiosis (Hevia et al., 2014; Nguyen et al., 2023; Scher et al., 2013; Xu et al., 2019; Yu et al., 2022; Zhang et al., 2015). While the role of the oral microbiome in the pathogenesis of pSS remains elusive, the number of studies on the oral microbiome in patients with pSS has increased in recent years. The microbiome has been analyzed in different oral sites and samples, including saliva (Rusthen et al., 2019; Sembler-Møller et al., 2019; Sharma et al., 2020; Siddiqui et al., 2016; Tseng et al., 2021; Zhou et al., 2018a), buccal swab samples (Li et al., 2016; van der Meulen et al., 2018a), oral washings (Alam et al., 2020; van der Meulen et al., 2018b; Zhou et al., 2018b), and tongue swab samples (de Paiva et al., 2016). The findings of these previous studies are diverse but indicate a lower abundance of Haemophilus (Alam et al., 2020; Li et al., 2016; van der Meulen et al., 2018a; Zhou et al., 2018b), Neisseria (Li et al. 2016; Rusthen et al., 2019; van der Meulen et al., 2018a; Zhou et al., 2018b), and Lautropia (Alam et al., 2020; van der Meulen et al., 2018a), and a higher abundance of Veillonella (Rusthen et al., 2019; Siddiqui et al., 2016; Singh et al., 2021; Zhou et al., 2018b) in patients with pSS compared to healthy controls. The results of a previous study also indicate that the spatial organization of microbial communities is shaped by the low whole saliva flow rates in Sjögren’s syndrome (Proctor et al., 2018).
In this study, we hypothesized that patients with pSS present a microbiome profile that is distinctively different from that of patients with non-pSS sicca and healthy controls across multiple oral sites, including stimulated whole saliva (SWS), supragingival plaque (SGP), buccal mucosa (BLM) and tongue scrape from the dorsal surface of the tongue (TGS), and this reflects the oral health status in terms of caries activity, gingivitis and oral infections. We investigated this by analyzing the oral microbiome samples by means of V3–V4 16S rRNA gene amplicon sequencing.
Materials and Methods
Study design and participants
This cross-sectional study included 59 female patients, who were all referred with suspicion of pSS by rheumatology and ophthalmology outpatient clinics or from dentists in private practice. Twenty-three patients fulfilled the American College of Rheumatology/European League against Rheumatism (ACR-EULAR) classification criteria for pSS (Shiboski et al., 2017), and 36 patients with Sjögren-like symptoms including oral and ocular dryness, did not fulfill the classification criteria for pSS (onwards designated non-pSS sicca). Additionally, we included 21 age- and gender-matched healthy control subjects. The inclusion criteria comprised age between 18 and 75 years for all participants, and no history of autoimmune diseases, xerostomia and hyposalivation and no intake of xerogenic medication for healthy controls. Exclusion criteria included use of antibiotics within the past 3 months, pregnant and nursing females, and patients with periodontal pocket depth of ≥ 6 mm on ≥ 4 teeth. The study was performed in accordance with the Declaration of Helsinki and approved by the Ethical Committees for the Region of Copenhagen, Denmark (H-18042385) and the Danish Data Protection Agency. General Data Protection Regulation (GDPR) was applied in the processing of personal data. Written informed consent was obtained from all participants.
Clinical examination and sample collection
All participants were examined by one investigator (SK) at the Clinic for Oral Medicine, Department of Odontology, the Faculty of Health and Medical Sciences, University of Copenhagen, calibrated with and assisted by a senior investigator (AMLP). All participants underwent a detailed standardized interview regarding overall health, daily intake of medicine, and use of tobacco and alcohol. Questionnaires including Bother 1 index (BI), Bother index 5 (BI5) and Xerostomia Inventory (XI) were completed to assess the severity of oral dryness (xerostomia) (Challacombe et al., 2015; Osailan et al., 2012). The clinical examination included registration of periodontal pocket depth, gingival index and plaque index on six index teeth, as well as registration of decayed, missed, filled teeth (DMF-T) and -sites (DMF-S) (for details, Pedersen et al., 1999). Unstimulated whole saliva was collected for 15 min using the draining method and chewing-stimulated whole saliva was collected for 5 min (as previously described, Pedersen et al., 1999). The collected saliva samples were immediately kept on ice, then aliquoted and stored at -80°C until analysis. Tongue scrapes and supragingival plaque were collected and dissolved in Tris-EDTA (TE) buffer, then stored at -20°C until analysis. A biopsy (5 × 5 × 4 mm) was obtained from the buccal mucosa under local anesthesia and stored in TE-buffer at -20°C until further analysis.
All participants underwent a minor salivary gland biopsy in the lower lip for histopathological evaluation, including focus scoring (for details Daniels, 1984; Kamounah et al., 2024; Pedersen et al., 1999).
DNA extraction and 16S rRNA gene amplicon sequencing
NucleoSpin Soil DNA kit (Macherey-Nagel, Germany) was used to extract genomic DNA from the bacterial pellets and negative controls. To lyse the bacterial cells in the pellet, the pellets were resuspended with optional enhancer SX solution and SL1 buffer, and lysed using Tissuelyser II (Qiagen, Germany) at a speed of 30 oscillations/sec for 5 min. The quality of extracted DNA was assessed using NanoDrop and Qubit Fluorometer (Thermo Fisher Scientific, USA). The V3–V4 variable region of 16S rRNA genes was sequenced using Illumina HiSeq 2500 (by BGI, China).
We recognize that 16S rRNA gene amplicon-based sequencing has its biases and pitfalls, as it may not accurately reflect absolute bacterial abundances, nor does it always possess the resolution for species/strain level resolution of certain taxa. Choice of variable regions covered by the amplicon influences these biases. In this study, we chose V3–V4 regions (longer amplicon but slight reduction in nucleotide accuracy in the middle of the amplicon region) over V4 region (shorter amplicon but high nucleotide accuracy across the entire amplicon region) because these longer amplicons provide improved species resolution for members of oral microbiome, e.g. Streptococcus spp. Sequencing near full-length V1–V8 amplicons using PacBio long-read technology will provide high accuracy as well as better taxonomic resolution, but it is prohibitively expensive, which precluded us from choosing that option.
Sequence quality control
DADA2 (v1.24.0) (Callahan et al., 2016) was used with default parameters for initial processing of reads which consisted of paired Illumina HiSeq 2500 amplicon sequencing reads representing the V3–V4 region of the 16S rRNA genes. Primers were removed, and the reads were filtered and trimmed after assessing quality. A truncation length of 260 bases for the forward reads and 210 bases for the reverse reads was determined. The high-quality filtered and trimmed reads were then dereplicated and merged per sample after chimeras were identified and removed. We used the removeBiomeraDenovo() method from the DADA2 package in R to identify chimeric sequences and remove them. We use the consensus method, with parameters ‘minSampleFraction = 0.4, minFoldParentOverAbundance = 1.2’.
While supragingival plaque, buccal mucosa and tongue scrape microbiomes were sequenced in a single batch of Illumina HiSeq 2500 run, SWS samples were sequenced in a separate batch. Therefore, we had to estimate the sequencing error rates separately for SWS. This error rate is a mandatory input for the core sample inference algorithm of DADA2, which thus bifurcates the rest of the analysis. Thus, we generated ASVs for the two different batches separately. After the initial DADA2 processing, 38874 unique ASVs were identified in SWS samples, and 95229 ASVs from the other three sites. There were 15987 ASVs in common.
This process was followed by the removal of chimeric ASVs. After chimera removal, 2373 ASVs were identified in the saliva samples, and 6129 ASVs in the remaining samples. There were 1779 ASVs in common. At this stage, we proceeded to assign taxonomy to these ASVs.
Taxonomic assignment
Taxonomy was assigned at the species level by means of the SILVA database (Quast et al., 2013), using ‘silva_nr99_v138.1_train_set.fa.gz’ for annotation at the genus level, and another database ‘silva_species_assignment_v138.1.fa.gz’ for species level resolution of taxonomic assignment.
We used the DADA2 Pipeline to taxonomically annotate ASVs using the SILVA database. We used the assignTaxonomy() function to annotate up to genus level, and then assignSpecies() function to add possible species annotation, both from the dada2 R package. The assignTaxonomy() function uses a naive Bayes RDP classifier (Wang et al. 2007) to classify reads into appropriate taxonomies, while the assignSpecies() function uses 100% sequence identity to annotate ASVs at the species level.
Identification and filtering of ASVs
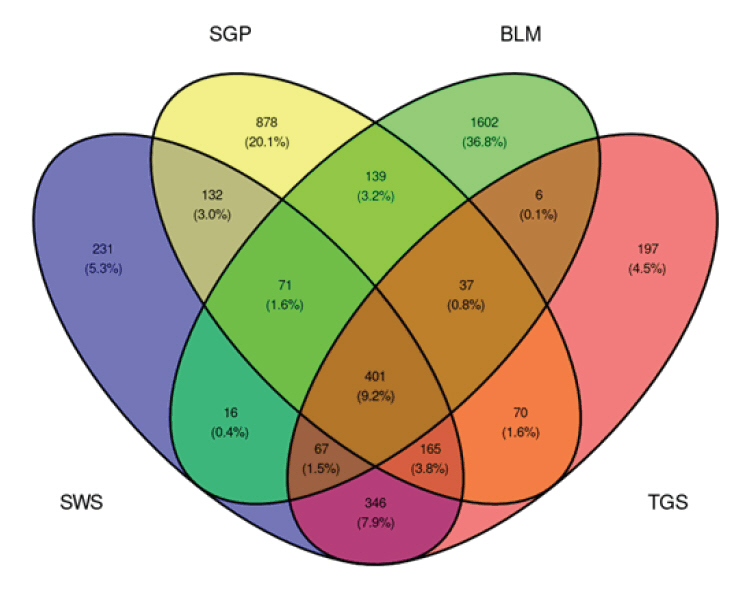
After taxonomic assignment, ASVs that were annotated as mitochondria and chloroplast were removed. Within each site, low abundant (< 0.0001 relative abundance) ASVs were removed. Additional filtration of ASVs according to their length resulted in 1429 ASVs for the SWS samples, 1893 for the SGP samples, 2339 for BLM samples, and 1289 for the TGS samples (Fig. 1).
Alpha and beta diversity
The phyloseq (v1.40.0) package (McMurdie and Holmes, 2013) was used for easy manipulation of the data, and helper functions from this package were used to compute alpha diversity measures (estimate_richness()) and beta diversity (plot_ordination()). The vegan (v2.6-2) package (Oksanen et al., 2022) was also used to compute the Bray-Curtis dissimilarity between samples for beta diversity (vegdist()). The R library microbiome (v1.18.0) (Lahti and Shetty, 2022) was also used for calculating relative abundances from count data (abundances()).
Graphing and image generation
Most images were generated in R using the packages ggplot2 (v3.3.6) (Wickham, 2016). The ggrepel (v0.9.1) (Slowikowski et al., 2021) package was used to ensure clean and neat labelling of plots with minimal overlap and clutter, and the ggpubr (v0.4.0) (Kassambara, 2020) package was used to additionally make plots cleaner, and combine multiple relevant plots in a single image.
Statistical analysis
The adonis2 function in the R vegan package (Oksanen et al., 2022) was used for PERMANOVA analysis. P-values were FDR-adjusted for multiple hypothesis testing. ANCOM from the package ANCOMBC was used (v1.6.4) to analyze the composition of the microbiome to obtain significantly different ASVs between conditions (that is pSS, non-pSS sicca, and healthy controls) while controlling for age as a confounder (Lin and Peddada, 2020). This statistical test accounts for variation included by age.
The clinical data from the pSS, non-pSS sicca and healthy control groups was compared by means of two-sample t-test (in case of normal distribution), and non-parametric Mann-Whitney U-test when data was not normally distributed. GraphPad Prism 10 was used as statistical software for these analyses.
We applied the widely used Benjamini-Hochberg method for controlling the false discovery rate (FDR) due to its balance between statistical power and error control, making it particularly suitable for high-dimensional datasets where multiple hypothesis testing is performed. FDR-adjusted P-value < 0.05 was considered statistically significant.
Results
Demographic and clinical characteristics of the participants
Table 1 summarizes the demographic, clinical, and pSS-related characteristics of the enrolled cohort. As 93% of the participants were females, with only two male participants in each group, we excluded male participants in statistical analysis to avoid reporting trends that may not be generalized due to this strong bias. At the time of diagnosis, the median age of the pSS cohort was 58 years. There were no significant differences between the patients with pSS and non-pSS in terms of age, gender, tobacco use, or severity of xerostomia. In addition, unstimulated and stimulated whole saliva flow rate values, the number of patients with hyposalivation, the score of gingival inflammation, and DMF-T/-S did not differ significantly between the two patient groups. The prevalence of keratoconjunctivitis sicca (p = 0.001), serum anti-SSA antibodies (p < 0.001), and labial salivary gland focus score ≥ 1 (p < 0.001) was significantly higher in patients with pSS than in patients with non-pSS sicca. The stimulated and unstimulated whole saliva flow rates were significantly lower in patients with both pSS (p < 0.001) and non-pSS sicca (p < 0.001) than in the healthy controls. DMF-T (p = 0.009) and DMF-S (p = 0.01) scores were significantly higher in the patients with pSS than in healthy controls, while no significant differences were found between pSS and non-pSS sicca nor non-pSS sicca and healthy controls.
Measures of microbiome diversity within and across samples
After processing the sequencing read data, alpha diversity was calculated for each of the four oral sites, and differences between groups of patients are shown in Fig. 2. Comparing pSS, non-pSS sicca and healthy controls, ASV richness was significantly lower in non-pSS sicca patients compared to healthy controls in all four sites (SWS, SGP, BLM, and TGS), with reduction in median richness of 12, 30, 45, and 18 ASVs, respectively (Fig. 2A). A corresponding reduction in Shannon diversity was only observed in SGP microbiomes (Fig. 2B). ASV richness was also lower in pSS patients compared to healthy controls in SGP and TGS microbiomes, with a reduction in median richness of 34 and 16 ASVs, respectively. A corresponding reduction in Shannon diversity was observed in TGS microbiomes.
To further investigate the effect of the salivary flow rate, we regrouped patients with pSS and non-pSS subjects based on their stimulated whole saliva flow rates and performed additional comparisons. Patients with abnormally low stimulated whole saliva secretion were determined to be those with a flow rate ≤ 0.70 ml/min, while the remaining were categorized as having stimulated whole saliva flow rates within the normal range. Patients with lower saliva flow rate exhibited a reduction in microbial alpha diversity: their SGP and TGS microbiomes showed a reduction in ASV richness (Fig. 2C, difference between median: 24 and 14, respectively) as well as Shannon diversity (Fig. 2D).
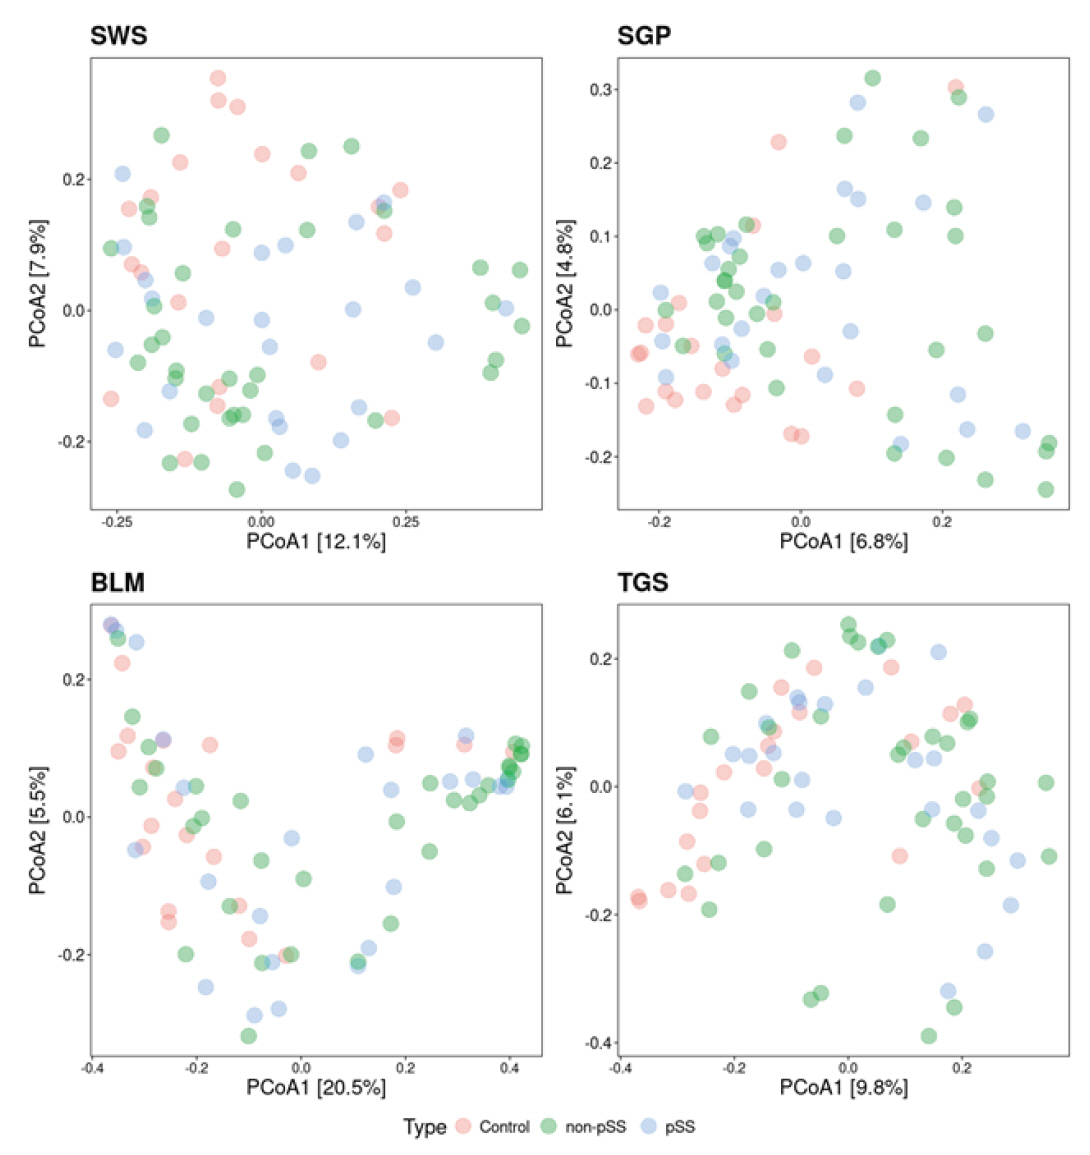
Beta diversity analysis was then performed with the Bray-Curtis dissimilarity being used as a measure of distance between samples (Fig. 3). To further investigate the effect of the diagnosis on beta diversity, PERMANOVA was performed, to investigate the amount of variation explained in the beta diversity by the disease state. In all four oral sites, the diagnosis had a significant effect on the beta diversity for SWS (p = 0.028), for SGP (p = 0.001), for BLM (p = 0.005), and for TGS (p = 0.007), explaining between 4.2% and 6.5% of the variance (Table 2). Similarly, saliva flow rate had a significant effect on the beta diversity for all four sites (p < 0.05), explaining between 2.4% and 3.4% of the variance (Table 3).
Differentially abundant microbial features
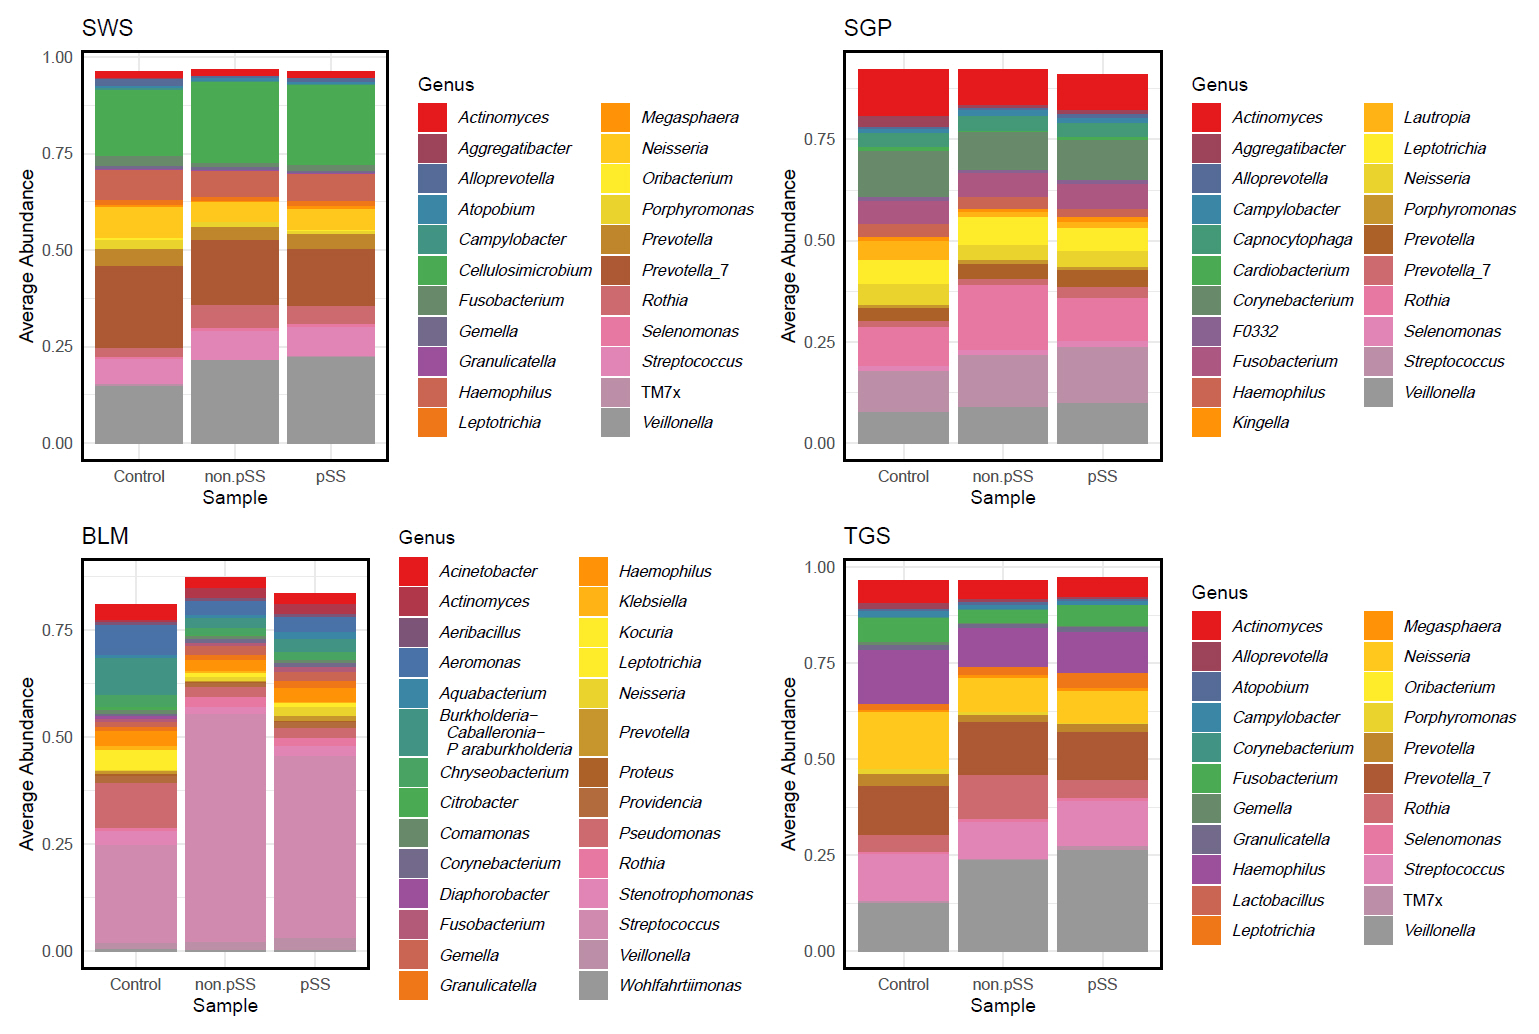
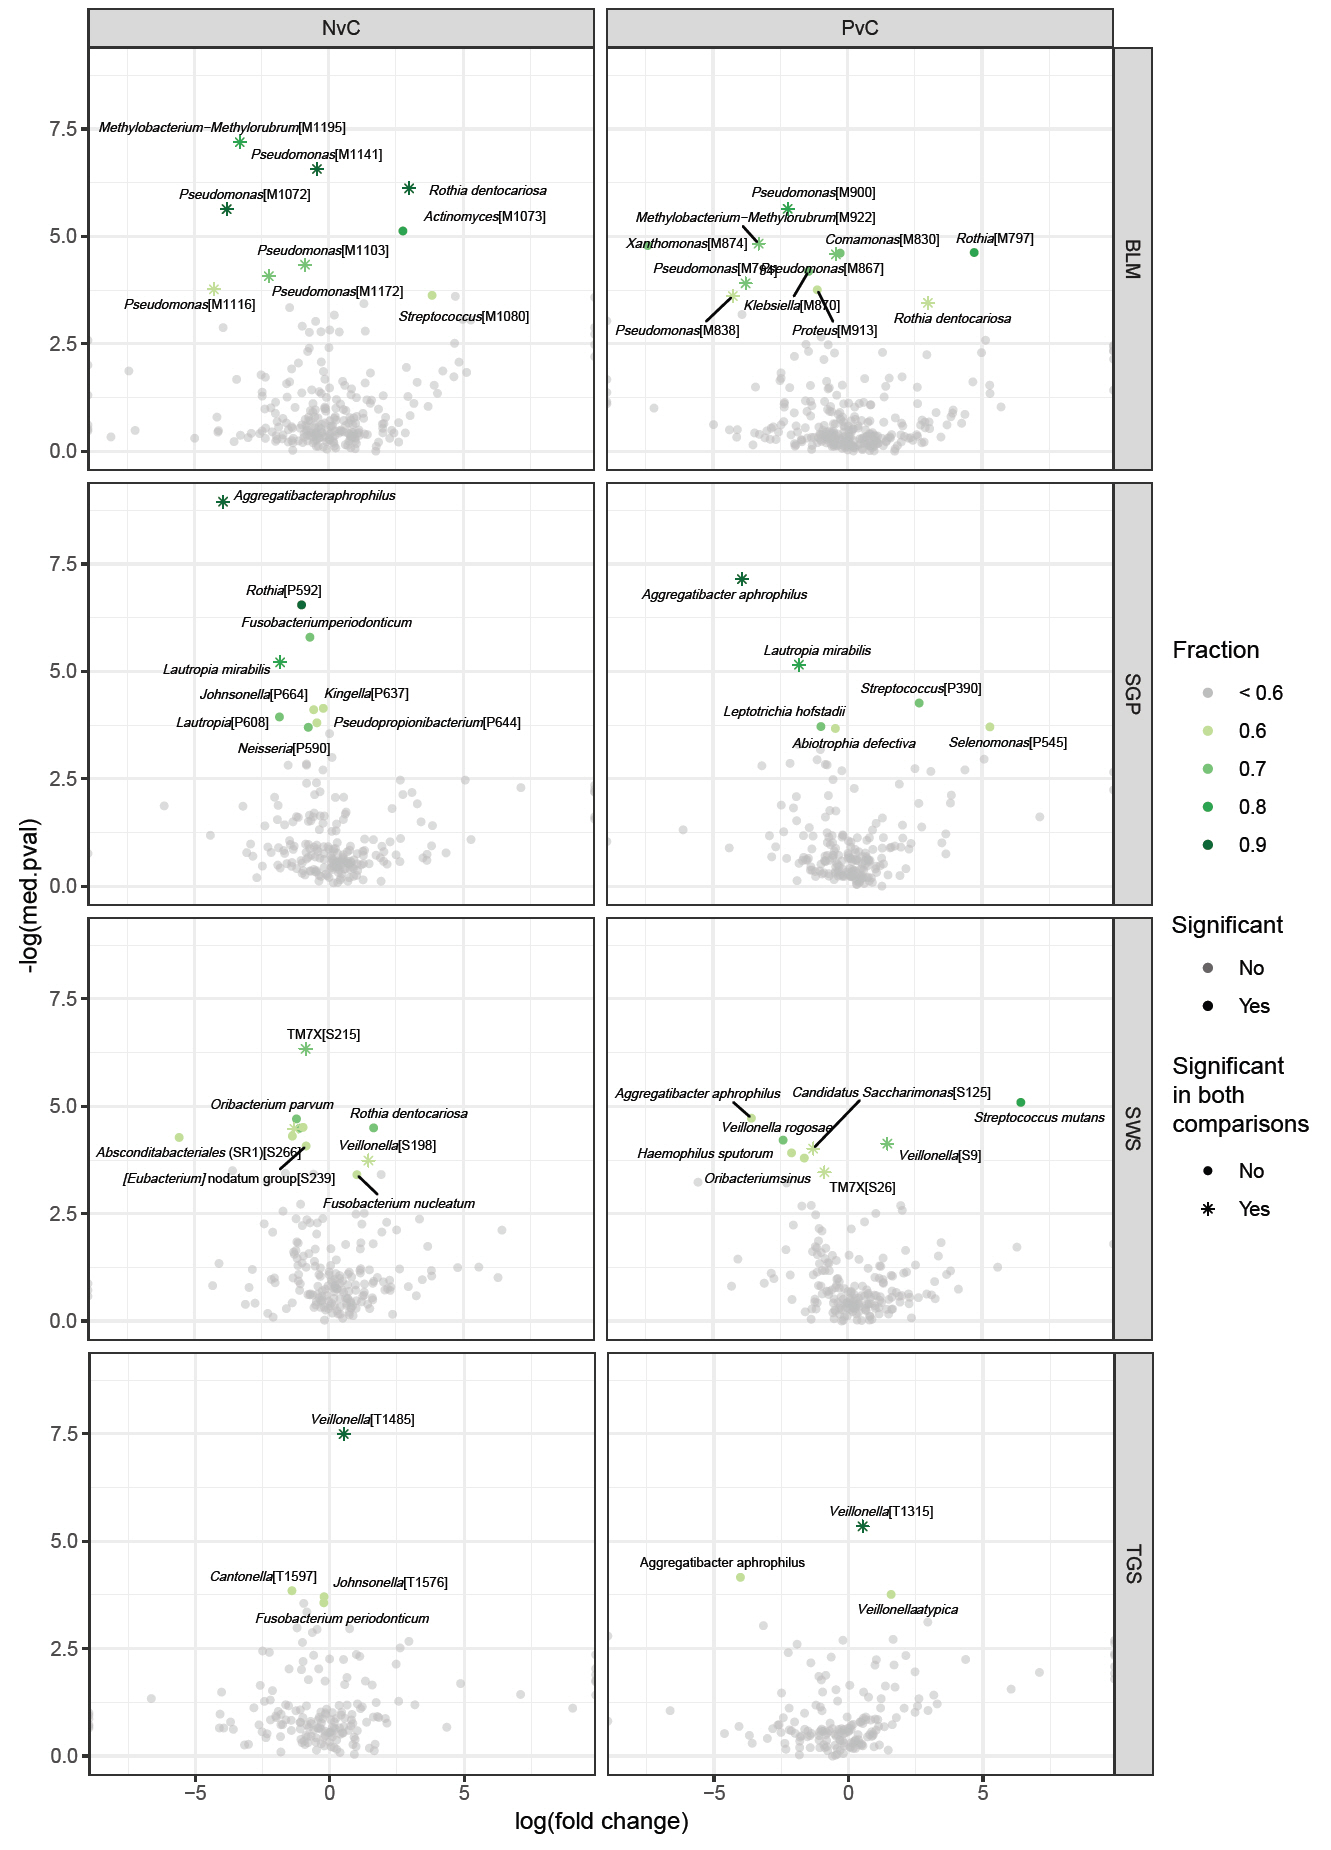
The average genus-level composition of the groups showed that different genera dominated different sites (Fig. 4; see Fig. S1 for sample-level genus composition). While the average pSS and non-pSS compositions looked very similar, some genus level differences are apparent between pSS and control (or) non-pSS versus healthy controls. To investigate potential ASVs that are associated with diagnosis (pSS, non-pSS, and control), a differential abundance analysis was conducted for each oral site across the three groups. A total of 61 significantly different ASVs across sites was identified, including 28 ASVs differing significantly between patients with pSS and healthy control, and 33 ASVs between patients with non-pSS sicca and healthy controls (Table S1 and Fig. S2). Nearly half from this list of ASVs belonged to just five genera: Pseudomonas, Veillonella, Rothia, Aggregatibacter, and Fusobacterium. We found no significant differences in ASVs between pSS and non-pSS sicca. In the SWS samples, there were 8 significantly different ASVs between pSS and healthy controls, and 11 significantly different ASVs between non-pSS sicca and healthy controls. In the SGP samples, there were 6 significantly different ASVs between pSS and healthy controls, and 9 significantly different ASVs between non-pSS and healthy controls. In TGS samples, there were three significantly different ASVs between pSS and healthy controls, and four significantly different ASVs between non-pSS sicca and healthy controls. In BLM samples, there were 11 significantly different ASVs between pSS and healthy controls, and 9 significantly different ASVs between non-pSS sicca and healthy controls. The results of this test are summarized in the volcano plot (Fig. 5). The abundance of Veillonella species, including V. atypica, was significantly higher in SWS and TGS from patients with pSS and non-pSS sicca compared to healthy controls. In addition, the abundance of V. rogosae was lower in SWS from pSS patients compared to healthy controls.
To further investigate the effect of the salivary flow rate, we performed an additional differential abundance analysis between patients with lower and higher saliva flow rate. Patients with abnormally low stimulated whole saliva secretion were determined to be those with a flow rate ≤ 0.70 ml/min, while the remaining were categorized as having stimulated whole saliva flow rates within the normal range. Performing this analysis across the four sites revealed three significantly different ASVs in SWS, 11 in SGP, 8 in TGS, but none in BLM (Table 4 and Fig. S3).
Discussion
In this study, we hypothesized that the microbiome is altered in multiple oral niches in patients with pSS. Overall, our data demonstrated many similarities but also some interesting differences compared to previous reported studies on the oral microbiome in patients with pSS. To our knowledge this is the first study to compare the microbiome in four different oral sites in patients with pSS compared to disease (non-pSS) and healthy control groups.
We found no significant differences between the two patient groups, pSS and non-pSS sicca, in terms of age, gender, tobacco use, dental status (DMF-T and DMF-S), saliva flow rates, and presence and severity of xerostomia. Additionally, there were no statistically significant differences in alpha diversity between patients with pSS and non-pSS sicca. However, the alpha diversity of the microbial community in SGP samples was significantly lower in the non-pSS sicca group than in the healthy control group. Furthermore, the alpha diversity was significantly lower in TGS samples in patients with pSS than in healthy controls. Our findings suggest that the distinct microbiome profile is associated with salivary gland hypofunction and not the pSS disease entity itself. This hypothesis was further confirmed when subgrouping pSS and non-pSS sicca patients according to their salivary flow rate rather than diagnosis, in which we found several ASVs with significantly different abundance.
A previous study reported that 8 individual bacterial taxa (including Haemophilus, Neisseria, and Lautropia) lost their association with pSS when the stimulated whole saliva flow rate was considered, suggesting that their relative abundances most likely are related to low salivary flow rates (van der Meulen et al., 2018a). However, additional taxa such as Granulicatella were still significantly associated with pSS when compared to the healthy control group, and when stimulated whole saliva flow rates were accounted for, suggesting a disease-specific association to pSS (van der Meulen et al., 2018a). Siddique et al. reported a higher abundance of Streptococcus and Veillonella species in patients with pSS, who had normal salivary secretion, suggesting that disturbances in the oral microbiota can occur independently of hyposalivation in pSS (Siddiqui et al., 2016).
In the present study, we did not find significant differences in ASVs between patients with pSS and non-pSS sicca, but the abundances of several bacteria were significantly different in patients with pSS and non-pSS sicca in comparison to healthy control subjects. In accordance with our findings, a recent study reported no differences in the oral microbiome between patients with pSS and non-pSS sicca using whole saliva samples to sequence the V1–V3 region (Sembler-Møller et al., 2019). Furthermore, we did not find significant differences in the whole saliva flow rates between patients with pSS and non-pSS sicca whereas both the unstimulated and stimulated whole saliva flow rates were significantly lower in pSS and non-pSS patients than in the healthy controls. These findings are in line with the findings reported by van der Meulen et al. (van der Meulen et al., 2018a). Thus, this suggest that it is not the underlying disease of pSS per se that causes changes in the oral microbiota, but more likely reduced salivary flow and the associated lower buffering capacity and salivary pH that causes a bacterial shift towards a higher proportion of aciduric and acidogenic lactic acid bacteria. This hypothesis was further supported by subgrouping patients based on their salivary flow rates (SWS > 0.7 ml/min versus SWS ≤ 0.7 ml/min), which revealed several significantly different ASVs between the two groups, in particular members of the lactic acid bacteria (Table 4). These findings are in accordance with those of a previous study suggesting that the low salivary flow rates in Sjögren’s syndrome shape the spatial gradient of bacterial diversity (Proctor et al., 2018).
A total of 61 ASVs in four oral sites differed significantly between healthy controls and patients with pSS and non-pSS sicca, including 19 ASVs in SWS, 15 in SGP, 20 in BLM and 7 in TGS samples. The levels of several Veillonella species, including V. atypica, were significantly higher in SWS and TGS in patients with pSS and non-pSS sicca than in healthy controls. These findings are in concordance with previous studies reporting a higher abundance of Veillonella in patients with pSS (Siddiqui et al., 2016; Singh et al., 2021; Xie et al., 2024; Zhou et al., 2018b). Veillonella species are Gram-negative bacteria anaerobic cocci characterized by their lactate-fermenting ability (Delwiche et al., 1985) and one of the most common genera in dental cavities. They are closely associated with acidogenic bacteria e.g., Streptococci (Aas et al., 2005; Belda-Ferre et al., 2012; Zhou et al., 2021). Veillonella species are known to have a bridging role in the oral biofilm and may facilitate the colonization of other pathogenic microorganisms in the oral cavity (Zhou et al., 2021). In our study, patients with pSS and non-pSS sicca had higher DMF-T/DMF-S scores than the healthy controls (although not significant for non-pSS sicca), reflecting a high caries experience, and therefore it is not surprising that the abundance of several Veillonella species were higher in the two patient groups. It further agrees with our observation that salivary levels of V. rogosae were lower among pSS patients compared to healthy controls, as this species is reportedly enriched in persons who are caries-free (Zhou et al., 2021). Our study also showed a reduction of Haemophilus sputorum in SWS microbiomes of pSS patients and reduction of Neisseria in SGP microbiomes of non-pSS patients, supporting the findings of previous studies (Li et al., 2016; van der Meulen et al., 2018a; Xie et al., 2024; Zhou et al., 2018b). It has been shown that patients with hyposalivation have a lower abundance of Neisseria compared to patients with normal salivary flow rates (Hayashi et al., 2014). Neisseria and Haemophilus exhibit low acid resistance and are not associated with caries. The relative abundance of both genera was found to be two-fold higher in patients with low caries experience than in patients with high caries experience (Belstrøm et al., 2017). Rothia species are predominantly observed in the oral cavity of healthy individuals and present in the initial biofilm (Zhou et al., 2018b). It has been shown that patients with pSS have a lower abundance of Rothia than healthy control subjects in oral rinse samples (Zhou et al., 2018b). Interestingly, we found a higher abundance of Rothia dentocariosa in SWS samples and BLM samples in patients with non-pSS sicca than in healthy controls, as well as a higher abundance of Rothia dentocariosa and Rothia aeria in BLM samples in patients with pSS than in healthy controls. However, the abundance of Rothia species in SGP samples was significantly lower in patients with non-pSS sicca than in healthy controls. A very recent study reported a higher relative abundance of Leptotrichia in saliva from patients with pSS than in healthy controls, and a higher relative abundance in plaque samples from patients with pSS, suggesting that Leptotrichia is related to dental caries in patients with pSS (Xie et al., 2024). However, we did not find a higher relative abundance of Leptotrichia on the genus level in any of the four sites, but a significantly lower relative abundance of Leptotrichia hofstadii in SGP samples in patients with pSS compared to healthy controls. Furthermore, we also found lower relative abundance of Leptotrichia in patients with abnormal low salivary secretion (SWS ≤ 0.7 ml/min) (Table 4).
Streptococcus mutans are Gram-positive cocci that are well-known for playing an important role in the formation of an anaerobic biofilm and are some of the primary pathogens of dental caries in humans (Hamada and Slade, 1980; Kawabata and Hamada, 1999). As expected, we found higher levels of Streptococcus mutans in SWS samples from patients with pSS, as these patients have a high caries experience. Furthermore, the patients with pSS had significantly lower whole saliva flow rates and higher DMF-T/DMF-S than in the healthy controls. In addition, our findings of a higher relative abundance of S. mutans in patients with pSS group agrees with the findings of previous studies (Almståhl et al., 2003; Kolavic et al., 1997). Interestingly, we found higher levels of Streptococci sp. on the dorsal surface of the tongue in patients with stimulated salivary flow rate > 0.7 ml/min than in those with flow rate ≤ 0.7 ml/min (Table 4).
Furthermore, we also found significantly higher levels of Lactobacillus in SWS, SGP, and TGS samples in patients with a SWS rate ≤ 0.70 ml/min, which is consistent with previously published literature that has also reported higher levels of Lactobacillus sp. in patients with low salivary flow rate (Almståhl et al., 2003; Guobis et al., 2011; Kolavic et al., 1997; Lundström and Lindström, 1995) (Table 4).
Overall, our study showed that there are no statistically significant differences in ASVs between patients with pSS and non-pSS sicca, but significant differences in multiple bacteria in all four sites between both patient groups and healthy controls, and in three sites (SWS, SGP, and TGS) between patients with high (> 0.7 ml/min) versus low (≤ 0.7 ml/min) stimulated whole saliva flow rates. Additionally, we identified several ASVs with significant different abundance when regrouping patients according to their salivary flow rate. Thus, our findings suggest that severe salivary gland hypofunction rather than pSS itself, modifies the composition of the oral microbiota in site-specific patterns. This can also explain why the two patient groups (pSS and non-pSS) were similar with respect to presence of oral diseases/conditions (caries, gingivitis etc.).
Acknowledgments
We would like to express our sincere gratitude to laboratory technician, Louise Rosgaard Duus, for her assistance in the laboratory analyses of the samples.
Author Contributions
Collection of samples and clinical data: S.K. and A.P. Analysis of clinical data: S.K. Bioinformatics analyses: A.S. and M.A. Data interpretation S.K., A.S., M.A., C.S., and A.P. Drafting the manuscript: S.K. All authors critically revised the manuscript and approved the final version.
Conflict of Interest
None of the authors have any competing interests to declare.
Funding
This study was funded by the Danish Dental Association Research Foundation, the Danish Rheumatism Association, and the Faculty of Health and Medical Sciences, University of Copenhagen. Novo Nordisk Foundation Center for Basic Metabolic Research is an independent research center, based at the University of Copenhagen, Denmark, and partially funded by an unconditional donation from the Novo Nordisk Foundation (grant numbers NNF18CC0034900 and NNF23SA0084103).
Data Availability
The data supporting the findings of this study is provided in the manuscript and the supplementary table. The 16S rRNA gene amplicon sequence files have been deposited at NCBI Short Read Archive under BioProject identifier PRJNA1176379.
Supplementary Information
The online version contains supplementary material available at https://doi.org/10.71150/jm.2501030.
Fig. S2.
(A) Heatmap of relative abundances of significantly different ASVs per site, between pSS and healthy controls, grouped by disease state. (B) Heatmap of relative abundances of significantly different ASVs per site, between non-pSS and healthy controls, grouped by disease state.
jm-2501030-Supplementary-Fig-S2.pdf
Table S1.
Glycans detected after B-elimination of stimulated saliva samples from three controls and three patients. Peeling products(p) and N-glycans (n) have been excluded
jm-2501030-Supplementary-Table-S1.xlsx
Fig. 1.Venn Diagram showing the number of ASVs unique to each sampling site and shared ASVs across sites. ASV, amplicon sequence variant; SWS, stimulated whole saliva; SGP, supragingival plaque; BLM, buccal mucosa; TGS, tongue scrapes.

Fig. 2.Comparison of microbiome alpha diversity measures across patient groups for the four sample sites. A, B ASV richness (A) and ASV Shannon diversity (B) between disease states (pSS, non-pSS and healthy controls). C, D ASV richness (C) and ASV Shannon diversity (D) between low- and high-flow rate subjects.
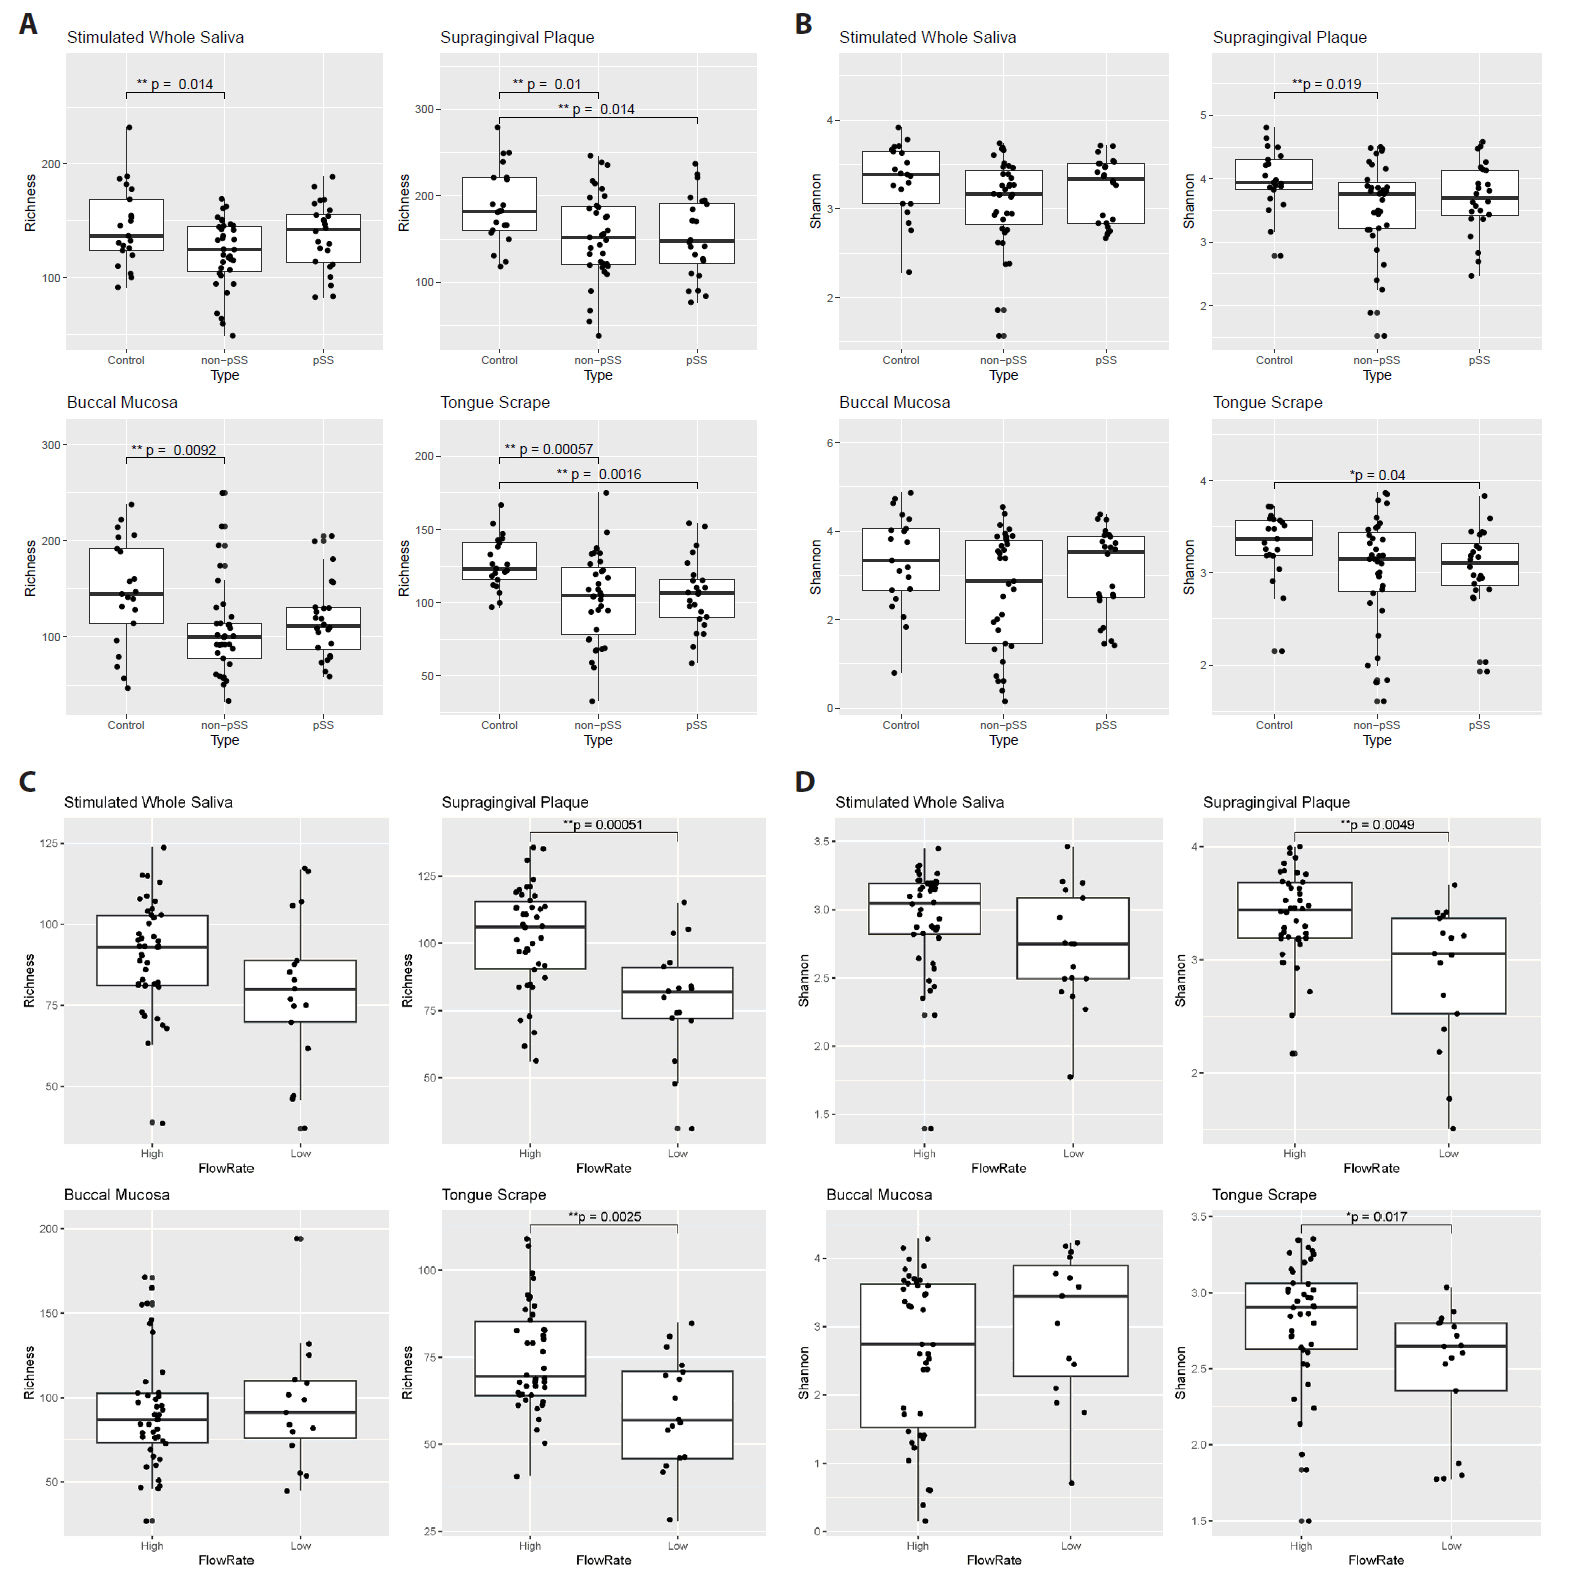
Fig. 3.Beta diversity of samples across the different sampling sites and disease states (pSS = blue dots, non-pSS = green, and healthy controls = pink dots). SWS, stimulated whole saliva; SGP, supragingival plaque; BLM, buccal mucosa; TGS, tongue scrapes; pSS, primary Sjögren’s syndrome.

Fig. 4.Group-wise mean genus relative abundance across different sites, with samples grouped by diagnosis. SWS, stimulated whole saliva; SGP, supragingival plaque; BLM, buccal mucosa; TGS, tongue scrapes.

Fig. 5.Differentially abundant ASVs from the ANCOM analysis comparing pSS or non-pSS samples with healthy controls in the four sample sites. log(fold change), log fold change of a given ASV between the two groups; -log(med.pval), the negative logarithm of the median p-value of the specific ASV; fraction, how often this ASV was significant in differential abundance tests when using every other ASV as the normalizing baseline (fraction > 0.6 is considered significant); pSS, primary Sjögren’s syndrome; NvC, non-pSS sicca versus healthy controls; PvC, pSS versus healthy controls; BLM, buccal mucosa; SGP, supragingival plaque; SWS, stimulated whole saliva; TGS, tongue scrapes.

Table 1.Demographic and clinical characteristics of the patients with pSS and non-pSS sicca and healthy control (HC) subjects. Values are given in mean ± SD, median (range) and in numbers of patients (%)
|
pSS (n =23) |
non-pSS (n =36) |
Healthy controls (n=21) |
P-value |
|
|
Age (years) |
58 ± 14 |
57 ± 12 |
58 ± 14 |
N.S. |
|
Female |
23 (100%) |
36 (100%) |
21 (100%) |
|
|
Current smokers |
6 (26%) |
11 (31%) |
1 (5%) |
N.S.*, ** |
|
0.02*** |
|
Dry eyes for > 3 months |
21 (91%) |
31 (86%) |
0 (0%) |
N.S.* |
|
<0.001**, *** |
|
Dry mouth for > 3 months |
19 (83%) |
31 (86%) |
0 (0%) |
N.S.* |
|
<0.001**, *** |
|
Xerostomia Inventory score |
39 (16–53) |
40 (16–55) |
13 (11–18) |
N.S.* |
|
<0.001**, *** |
|
Hyposalivaton (UWS ≤ 0.10 ml/min) |
9 (39%) |
13 (36%) |
0 (0%) |
N.S.* |
|
0.002** |
|
0.005*** |
|
Keratoconjunctivitis sicca |
20 (87%) |
10 (28%) |
N.A. |
0.001* |
|
|
Positive serum anti-SSA/Ro antibody, |
20 (87%) |
9 (25%) |
N.A. |
<0.001* |
|
|
Focus score ≥ 1 |
16 (70%) |
0 (0%) |
0 (0%) |
<0.001*, ** |
|
N.S.*** |
|
UWS (ml/min) |
0.18 ± 0.16 |
0.20 ± 0.18 |
0.46 ± 0.30 |
N.S.* |
|
Median (range) |
0.18 (0.005–0.63) |
0.18 (0.01–0.94) |
0.36 (0.12–1.19) |
<0.001**, *** |
|
SWS (ml/min) |
1.04 ± 0.73 |
1.46 ± 1.00 |
2.21 ± 0.79 |
N.S.* |
|
Median (range) |
0.82 (0.08–2.92) |
1.29 (0.16–4.62) |
2.26 (1.1–3.9) |
<0.001**, *** |
|
Plaque index |
0.72 ± 0.55 |
0.42 ± 0.24 |
0.34 ± 0.14 |
0.03*, |
|
Median (range) |
0.5 (0.04–2.13) |
0.33 (0.04–1.13) |
0.33 (0.08–0.63) |
0.005**, |
|
|
|
|
N.S.*** |
|
Gingival index |
0.74 ± 0.66 |
0.50 ± 0.34 |
0.41 ± 0.24 |
N.S. |
|
Median (range) |
0.58 (0–2.67) |
0.5 (0–1.29) |
0.29 (0.13–0.88) |
|
DMFT |
17.09 ± 7.64 |
14.42 ± 7.29 |
11.24 ± 5.55 |
N.S.*, *** |
|
Median (range) |
18 (2–28) |
13 (0–28) |
12 (0–21) |
0.009** |
|
DMFS |
56.44 ± 38.43 |
42.56 ± 32.87 |
30.33 ± 20.92 |
N.S.*, *** |
|
Median (range) |
53 (7–138) |
30 (0–140) |
26 (0–63) |
0.01** |
Table 2.Proportion of variance in beta diversity explained by the disease state (pSS and non-pSS) in all four sites using the PERMANOVA analysis
|
Sample site |
R2
|
P-adj |
|
Stimulated whole saliva |
0.04209 |
0.028 |
|
Supragingival plaque |
0.04846 |
0.001 |
|
Buccal mucosa |
0.06539 |
0.005 |
|
Dorsal surface of the tongue |
0.04288 |
0.007 |
Table 3.Proportion of variance in beta diversity explained by the salivary flow rate in all four sites using the PERMANOVA
|
Sample site |
R2
|
P-adj |
|
Stimulated whole saliva |
0.02986 |
0.005 |
|
Supragingival plaque |
0.02608 |
0.002 |
|
Buccal mucosa |
0.02371 |
0.049 |
|
Dorsal surface of the tongue |
0.03363 |
0.002 |
Table 4.List of ASVs significantly associated with salivary flow rate 0.70 ml/min. ASVs are annotated at genus level (and when possible at species level)
|
Stimulated whole saliva |
Supragingival plaque |
Dorsal surface of the tongue |
|
· Fusobacterium periodonticum
|
· Leptotrichia [P30] |
· Fusobacterium periodonticum
|
|
· TM7x (Family Saccharimonadaceae) [S31] |
· Corynebacterium [P31] |
· Leptotrichia [T30] |
|
· Lactobacillus [S163] |
· Ligilactobacillus [P150] |
· Streptococcus [T45] |
|
· Lactobacillus [P168] |
· Ligilactobacillus [T153] |
|
· Scardovia wiggsiae
|
· Lactobacillus [T171] |
|
· Limosilactobacillus [P200] |
· Scardovia wiggsiae
|
|
· Atopobium parvulum
|
· Limosilactobacillus [T201] |
|
· Lactobacillus [P335] |
· Lacticaseibacillus [T429] |
|
· Parascardovia denticolens
|
|
|
· Lacticaseibacillus [P398] |
|
|
· HT002 (Family Lactobacillaceae) [P399] |
|
References
- Aas JA, Paster BJ, Stokes LN, Olsen I, Dewhirst FE. 2005. Defining the normal bacterial flora of the oral cavity. J Clin Microbiol. 43: 5721–5732. ArticlePubMedPMCLink
- Alam J, Lee A, Lee J, Kwon DI, Park HK, et al. 2020. Dysbiotic oral microbiota and infected salivary glands in Sjögren’s syndrome. PLoS One. 15: e0230667. ArticlePubMedPMC
- Almståhl A, Wikström M, Stenberg I, Jakobsson A, Fagerberg-Mohlin B. 2003. Oral microbiota associated with hyposalivation of different origins. Oral Microbiol Immunol. 18: 1–8. ArticlePubMedLink
- Belda-Ferre P, Alcaraz LD, Cabrera-Rubio R, Romero H, Simón-Soro A, et al. 2012. The oral metagenome in health and disease. ISME J. 6: 46–56. ArticlePubMedPMCPDF
- Belstrøm D, Holmstrup P, Fiehn NE, Kirkby N, Kokaras A, et al. 2017. Salivary microbiota in individuals with different levels of caries experience. J Oral Microbiol. 9: 1270614.ArticlePubMedPMCLink
- Brito-Zerón P, Baldini C, Bootsma H, Bowman SJ, Jonsson R, et al. 2016. Sjögren syndrome. Nat Rev Dis Primers. 2: 16047.PubMed
- Callahan BJ, McMurdie PJ, Rosen MJ, Han AW, Johnson AJA, et al. 2016. DADA2: High-resolution sample inference from Illumina amplicon data. Nat Methods. 13: 581–583. ArticlePubMedPMCPDF
- Challacombe SJ, Osailan SM, Proctor GB. 2015. Clinical scoring scales for assessment of dry mouth. In Carpenter G. (ed.), Dry mouth, pp. 119–132. Springer Berlin, Heidelberg.
- Daniels TE. 1984. Labial salivary gland biopsy in Sjögren’s syndrome. Arthritis Rheum. 27: 147–156. ArticlePubMed
- Dawes C, Pedersen AML, Villa A, Ekström J, Proctor GB, et al. 2015. The functions of human saliva: A review sponsored by the World Workshop on Oral Medicine VI. Arch Oral Biol. 60: 863–874. ArticlePubMed
- de Paiva CS, Jones DB, Stern ME, Bian F, Moore QL, et al. 2016. Altered mucosal microbiome diversity and disease severity in Sjögren syndrome. Sci Rep. 6: 23561.PubMedPMC
- Delwiche EA, Pestka JJ, Tortorello ML. 1985. The veillonellae: Gram-negative cocci with a unique physiology. Annu Rev Microbiol. 39: 175–193. ArticlePubMed
- Fujiwara N, Kitamura N, Yoshida K, Yamamoto T, Ozaki K, et al. 2020. Involvement of Fusobacterium species in oral cancer progression: A literature review including other types of cancer. Int J Mol Sci. 21: 6207.ArticlePubMedPMC
- Guobis Ž, Kareivienė V, Basevičienė N, Paipalienė P, Niedzelskienė I, et al. 2011. Microflora of the oral cavity in patients with xerostomia. Medicina (Kaunas). 47: 646–651. ArticlePubMed
- Hamada S, Slade HD. 1980. Biology, immunology, and cariogenicity of Streptococcus mutans. Microbiol Rev. 44: 331–384. ArticlePubMedPMCLink
- Hayashi Y, Saito T, Ohshima T, Nakagawa Y, Arita T, et al. 2014. Terminal RFLP analysis to determine the oral microbiota with hyposalivation. Arch Microbiol. 196: 489–496. ArticlePubMedPDF
- Hevia A, Milani C, López P, Cuervo A, Arboleya S, et al. 2014. Intestinal dysbiosis associated with systemic lupus erythematosus. mBio. 5: e01548–14. ArticlePubMedPMCLink
- Kamounah S, Wei F, Park JK, Song YW, Chia D, et al. 2024. Seronegative patients with primary Sjögren’s syndrome and non-pSS sicca test positive for anti-SSA/Ro52 and -Ro60 in saliva. Biochim Biophys Acta Mol Basis Dis. 1870: 167168.ArticlePubMed
- Kassambara, A. 2020. ggpubr: 'ggplot2' based publication ready plots. v0.4.0. https://cran.r-project.org/package=ggpubr.
- Kawabata S, Hamada S. 1999. Studying biofilm formation of mutans streptococci. Methods Enzymol. 310: 513–523. PubMed
- Kolavic SA, Gibson G, Al-Hashimi I, Guo IY. 1997. The level of cariogenic microlorganisms in patients with Sjögren’s syndrome. Spec Care Dentist. 17: 65–69. ArticlePubMed
- Lahti L, Shetty S. 2022. Microbiome: utilities for microbiome analysis. v1.18.0. https://github.com/microbiome/microbiome.
- Li M, Zou Y, Jiang Q, Jiang L, Yu Q, et al. 2016. A preliminary study of the oral microbiota in Chinese patients with Sjögren’s syndrome. Arch Oral Biol. 70: 143–148. ArticlePubMed
- Lin H, Peddada SD. 2020. Analysis of compositions of microbiomes with bias correction. Nat Commun. 11: 3514.ArticlePubMedPMCPDF
- Lundström IM, Lindström FD. 1995. Subjective and clinical oral symptoms in patients with primary Sjögren’s syndrome. Clin Exp Rheumatol. 13: 725–731. PubMed
- Lynge Pedersen AM, Belstrøm D. 2019. The role of natural salivary defences in maintaining a healthy oral microbiota. J Dent. 80: S3–S12. ArticlePubMed
- Mandl T, Marsal J, Olsson P, Ohlsson B, Andréasson K. 2017. Severe intestinal dysbiosis is prevalent in primary Sjögren’s syndrome and is associated with systemic disease activity. Arthritis Res Ther. 19: 237.ArticlePubMedPMCPDF
- Mariette X, Criswell LA. 2018. Primary Sjögren’s syndrome. N Engl J Med. 378: 931–939. ArticlePubMed
- McMurdie PJ, Holmes S. 2013. phyloseq: An R package for reproducible interactive analysis and graphics of microbiome census data. PLoS One. 8: e61217. ArticlePubMedPMC
- Mendez R, Watane A, Farhangi M, Cavuoto KM, Leith T, et al. 2020. Gut microbial dysbiosis in individuals with Sjögren’s syndrome. Microb Cell Fact. 19: 1348.ArticlePubMedPMCPDF
- Moon J, Choi SH, Yoon CH, Kim MK. 2020. Gut dysbiosis is prevailing in Sjögren’s syndrome and is related to dry eye severity. PLoS One. 15: e0229029. ArticlePubMedPMC
- Nguyen AD, Andréasson K, McMahan ZH, Bukiri H, Howlett N, et al. 2023. Gastrointestinal tract involvement in systemic sclerosis: The roles of diet and the microbiome. Semin Arthritis Rheum. 60: 152185.ArticlePubMedPMC
- Oksanen J, Blanchet FG, Friendly M, Kindt R, Legendre P. 2022. Vegan: community ecology package. v2.6-2. https://cran.r-project.org/package=vegan.
- Osailan SM, Pramanik R, Shirlaw P, Proctor GB, Challacombe SJ. 2012. Clinical assessment of oral dryness: development of a scoring system related to salivary flow and mucosal wetness. Oral Surg Oral Med Oral Pathol Oral Radiol. 114: 597–603. ArticlePubMed
- Pedersen AML, Bardow A, Nauntofte B. 2005. Salivary changes and dental caries as potential oral markers of autoimmune salivary gland dysfunction in primary Sjögren’s syndrome. BMC Clin Pathol. 5: 4.ArticlePubMedPMCPDF
- Pedersen AM, Reibel J, Nordgarden H, Bergem HO, Jensen JL, et al. 1999. Primary Sjögren’s syndrome: salivary gland function and clinical oral findings. Oral Dis. 5: 128–138. ArticlePubMed
- Proctor DM, Fukuyama JA, Loomer PM, Armitage GC, Lee SA, et al. 2018. A spatial gradient of bacterial diversity in the human oral cavity shaped by salivary flow. Nat Commun. 9: 681.ArticlePubMedPMCPDF
- Quast C, Pruesse E, Yilmaz P, Gerken J, Schweer T, et al. 2013. The SILVA ribosomal RNA gene database project: improved data processing and web-based tools. Nucleic Acids Res. 41: D590–D596. ArticlePubMedPMC
- Rusthen S, Kristoffersen AK, Young A, Galtung HK, Petrovski BÉ. 2019. Dysbiotic salivary microbiota in dry mouth and primary Sjögren’s syndrome patients. PLoS One. 14: e0218319. ArticlePubMedPMC
- Scher JU, Sczesnak A, Longman RS, Segata N, Ubeda C, et al. 2013. Expansion of intestinal Prevotella copri correlates with enhanced susceptibility to arthritis. eLife. 2: e01202. ArticlePubMedPMCPDF
- Sembler-Møller ML, Belstrøm D, Locht H, Enevold C, Pedersen AML. 2019. Next-generation sequencing of whole saliva from patients with primary Sjögren’s syndrome and non-Sjögren’s sicca reveals comparable salivary microbiota. J Oral Microbiol. 11: 1660566.ArticlePubMedPMC
- Sharma D, Sandhya P, Vellarikkal SK, Surin AK, Jayarajan R, et al. 2020. Saliva microbiome in primary Sjögren’s syndrome reveals distinct set of disease‐associated microbes. Oral Dis. 26: 295–301. ArticlePubMedLink
- Shiboski CH, Shiboski SC, Seror R, Criswell LA, Labetoulle M, et al. 2017. 2016 American College of Rheumatology/European League Against Rheumatism classification criteria for primary Sjögren’s syndrome: a consensus and data‐driven methodology involving three international patient cohorts. Arthritis Rheumatol. 69: 35–45. ArticlePubMedPMCLink
- Siddiqui H, Chen T, Aliko A, Mydel PM, Jonsson R, et al. 2016. Microbiological and bioinformatics analysis of primary Sjögren’s syndrome patients with normal salivation. J Oral Microbiol. 8: 31119.ArticlePubMedPMC
- Singh M, Teles F, Uzel NG, Papas A. 2021. Characterizing microbiota from Sjögren’s syndrome patients. JDR Clin Transl Res. 6: 324–332. ArticlePubMedPMCLink
- Slowikowski K, Schep A, Hughes S, Dang T, Lukauskas S. 2021. ggrepel: automatically position non-overlapping text labels with 'Ggplot2'. v0.9.1. https://cran.r-project.org/package=ggrepel.
- Thorlacius GE, Björk A, Wahren-Herlenius M. 2023. Genetics and epigenetics of primary Sjögren syndrome: implications for future therapies. Nat Rev Rheumatol. 19: 288–306. ArticlePubMedPMCPDF
- Tseng YC, Yang HY, Lin WT, Chang CB, Chien HC, et al. 2021. Salivary dysbiosis in Sjögren’s syndrome and a commensal-mediated immunomodulatory effect of salivary gland epithelial cells. NPJ Biofilms Microbiomes. 7: 21.ArticlePubMedPMCPDF
- van der Meulen TA, Harmsen HJM, Bootsma H, Liefers SC, Vich Vila A, et al. 2018a. Dysbiosis of the buccal mucosa microbiome in primary Sjögren’s syndrome patients. Rheumatology. 57: 2225–2234. Article
- van der Meulen TA, Harmsen HJM, Bootsma H, Liefers SC, Vich Vila A, et al. 2018b. Reduced salivary secretion contributes more to changes in the oral microbiome of patients with primary Sjögren’s syndrome than underlying disease. Ann Rheum Dis. 77: 1542–1544. Article
- Wang Q, Garrity GM, Tiedje JM, Cole JR. 2007. Naïve Bayesian classifier for rapid assignment of rRNA sequences into the new bacterial taxonomy. Appl Environ Microbiol. 73: 5261–5267. ArticlePubMedPMCLink
- Wickham H. 2016. ggplot2: Elegant graphics for data analysis. Springer Cham.
- Xie Y, Fan Y, Su M, Wang Y, Zhang G. 2024. Characteristics of the oral microbiota in patients with primary Sjögren’s syndrome. Clin Rheumatol. 43: 1939–1947. ArticlePubMedPDF
- Xu H, Liu M, Cao J, Li X, Fan D, et al. 2019. The dynamic interplay between the gut microbiota and autoimmune diseases. J Immunol Res. 2019: 7546047.ArticlePubMedPMCPDF
- Yan Z, Young AL, Hua H, Xu Y. 2011. Multiple oral Candida infections in patients with Sjögren’s syndrome — prevalence and clinical and drug susceptibility profiles. J Rheumatol. 38: 2428–2431. ArticlePubMed
- Yu D, Du J, Pu X, Zheng L, Chen S, et al. 2022. The gut microbiome and metabolites are altered and interrelated in patients with rheumatoid arthritis. Front Cell Infect Microbiol. 11: 763507.ArticlePubMedPMC
- Zhang X, Zhang D, Jia H, Feng Q, Wang D, et al. 2015. The oral and gut microbiomes are perturbed in rheumatoid arthritis and partly normalized after treatment. Nat Med. 21: 895–905. ArticlePubMedPDF
- Zhou S, Cai Y, Wang M, Yang W, Duan N. 2018a. Oral microbial flora of patients with Sicca syndrome. Mol Med Rep. 18: 4895–4903. ArticlePubMedPMC
- Zhou Z, Ling G, Ding N, Xun Z, Zhu C, et al. 2018b. Molecular analysis of oral microflora in patients with primary Sjögren’s syndrome by using high-throughput sequencing. PeerJ. 6: e5649. ArticlePubMedPMCPDF
- Zhou P, Manoil D, Belibasakis GN, Kotsakis GA. 2021. Veillonellae: Beyond bridging species in oral biofilm ecology. Front Oral Health. 2: 774115.ArticlePubMedPMC
Citations
Citations to this article as recorded by


 ePub Link
 Cite this Article