ABSTRACT
-
Aeromonas hydrophila (A. hydrophila) is an infectious agent that can infect both fish and humans, posing significant threats to aquaculture and public health. Iron acquisition is essential for bacterial survival, colonization, and pathogenicity, as it is crucial to many metabolic and enzymatic processes. Ferrous iron transporter B (FeoB) is a major component of the bacterial iron uptake system, mediating the transport of ferrous iron (Fe2+) and playing a key role in cellular iron homeostasis. The present study elucidates the role of FeoB in iron utilization, bacterial physiology, and pathogenicity of A. hydrophila ATCC 7966. A stable feoB-deleted mutant strain (AhΔfeoB) and its complemented strain (CΔfeoB) were constructed. Our results demonstrated that deletion of feoB impaired ferrous‑iron accumulation and substrate affinity, significantly increased sensitivity to clindamycin, sodium deoxycholate, and oxidative stress, reduced biofilm formation, and downregulated biofilm-associated genes. Furthermore, loss of the feoB gene resulted in abnormal cellular morphology and altered expression of 12 out of 15 tested virulence-related genes. Unlike in previous reports, AhΔfeoB showed no significant differences in growth characteristics, hemolytic activity and virulence in a BALB/c mouse infection model under iron-limited conditions. Moreover, DIA-based proteomic analysis revealed that feoB is a core protein essential for iron homeostasis, and its deletion profoundly impacts bacterial metabolism, adaptability, and iron transport. These findings emphasize the central role of FeoB in iron homeostasis and in the regulation of critical physiological functions in A. hydrophila ATCC 7966.
-
Keywords: FeoB, Aeromonas hydrophila, iron homeostasis, ferrous iron transporter, biofilm formation, DIA proteomics
Introduction
Iron is an essential micronutrient for bacterial pathogens, acting as a critical cofactor for enzymes and proteins involved in electron transport, DNA replication, oxidative phosphorylation, and various metabolic processes (Guan et al., 2025; Shadangi et al., 2025). However, in the host microenvironment, free iron availability is extremely limited due to sequestration in ferric (Fe³⁺) form by a host defense strategy termed nutritional immunity (Hood and Skaar, 2012). Pathogenic bacteria have evolved diverse iron acquisition systems to overcome iron limitation, among which the ferrous iron (Fe2+) transport system encoded by the feo operon, which produces three core proteins (FeoA, FeoB, and FeoC). FeoB acts as an indispensable transmembrane transporter and the functional core of the system, and it is one of the most conserved and predominantly functions under anaerobic or microaerophilic conditions (Gómez-Garzón et al., 2022; Lau et al., 2016; Shin et al., 2020). FeoB plays a critical role in bacterial virulence, environmental adaptability, and stress resistance. In Gram-negative pathogens including Escherichia coli, Salmonella enterica, Helicobacter pylori, Aeromonas veronii, and Riemerella anatipestifer, feoB deletion impairs host colonization, intracellular survival, oxidative stress tolerance, biofilm formation and in vivo pathogenicity (Guan et al., 2025; Huang et al., 2023; Kammler et al., 1993; Naikare et al., 2006; Tsolis et al., 1996; Velayudhan et al., 2000).
Aeromonas hydrophila is a Gram-negative opportunistic pathogen that infects aquatic organisms and mammals, including humans, causing severe aquatic animal diseases and human clinical infections (Chen et al., 2026). Its high environmental adaptability and pathogenicity rely on efficient iron acquisition systems to survive in iron-limited environments and host niches (Lange et al., 2020). Moreover, regulation of iron homeostasis is a well-recognized determinant of its virulence (Teng et al., 2018). However, the biological role and regulatory mechanism of FeoB-mediated Fe2+ transport in A. hydrophila remain uncharacterized. Although FeoB has been verified to modulate motility, biofilm formation, adhesion, invasion capability and virulence in Aeromonas veronii, significant interspecific differences in iron acquisition systems, Fur regulatory patterns and virulence mechanisms exist between A. veronii and A. hydrophila (Guan et al., 2025; Ran et al., 2018). The biological function and molecular mechanism of FeoB-mediated Fe2+ transport in A. hydrophila remain unclear.
In this study, a stable feoB deletion mutant (AhΔfeoB) and its complemented strain were constructed in A. hydrophila ATCC 7966 via homologous recombination. Phenotypic assays were performed to investigate the roles of feoB in bacterial growth, iron utilization, motility, hemolytic activity, stress tolerance, antibiotic resistance, and biofilm formation. Additionally, BALB/c mouse infection models, quantitative real-time PCR (qRT-PCR) and data-independent acquisition (DIA) quantitative proteomics were applied to explore the regulatory mechanism of FeoB in bacterial virulence.
This study clarifies the essential functions of feoB in iron homeostasis and pathogenicity, providing a promising target for novel anti-A. hydrophila antimicrobial development.
Materials and Methods
Strains, plasmids, and culture conditions
A. hydrophila ATCC 7966, Escherichia coli DH5α and E. coli S17-λpir were used in this study. A. hydrophila was cultured at 30°C in Luria–Bertani (LB) medium, E. coli strains were maintained at 37°C. The plasmids pRE112 and pBBR1MCS1 were used for gene deletion and genetic complementation, respectively. Ampicillin (Amp, 50 μg/ml) was supplemented when necessary (Table 1).
Experimental animals, anesthesia, and euthanasia
Female BALB/c mice (4–6 weeks old) were obtained from the Hebei CDC (Shijiazhuang, China) and maintained at 23°C, under a 12 h light/dark cycle with free access to food and water throughout the experiment. All animal procedures were approved by the Animal Ethics Committee of Hebei Normal University (IACUC No. LLSC2025091) and conducted in accordance with the guidelines of Hebei Province experimental animal care, China. Mice were euthanized via intraperitoneal injection of pentobarbital sodium (50 mg/kg) and euthanized by cervical dislocation to minimize suffering.
Generation and verification of the feoB mutant and complemented strains
The feoB-deficient mutant (AhΔfeoB) was generated via homologous recombination using the suicide vector pRE112. The flanking regions of feoB gene (1,014 bp) were PCR-amplified from A. hydrophila genomic DNA, yielding a fragment containing 446 bp upstream of the translational start site (ATG) and 568 bp downstream of the stop codon (TCA). The amplified fragment was cloned into pRE112 to generate the recombinant construct pAR1. After verification by sequencing, pAR1 was introduced into A. hydrophila via conjugation (Li et al., 2023b). The feoB-deficient mutant was obtained by double crossover homologous recombination and confirmed by PCR (Zhao et al., 2022).
For complementation, the full-length feoB open reading frame was amplified and cloned into pBBR1MCS1. The recombinant plasmid pBR-feoB was then electroporated into AhΔfeoB to generate the complemented strain CΔfeoB (Wang et al., 2020).
Growth curve assessment
The growth profiles of WT, AhΔfeoB, and CΔfeoB were evaluated in LB media using the Bioscreen C automated growth analyzer. Overnight cultures were normalized to equal cell densities with or without 0.6 mM 2,2'-dipyridyl (DIP) (Teng et al., 2018). For iron stress assays, strains were cultivated in M9 minimal medium with or without 0.2 mM FeSO4 supplementation, as described previously (Brown et al., 2023), while uninoculated LB medium served as the blank control. OD600 values were measured at 2 h intervals and bacterial cell counts were determined by colony-forming unit (CFU) enumeration (Muhammad et al., 2020).
Motility and hemolysis evaluation
Swimming and swarming motilities were examined using 0.25% (w/v) LB agar and 0.35% (w/v) swarm agar, respectively. The motility was measured by examining the diameter of bacterial motility from the center toward the periphery of the plates (Liu et al., 2025b). The hemolytic activity was evaluated by inoculating onto sheep blood agar plates at 30℃ for 24 to 48 h (Li et al., 2023a).
Measurement of intracellular ferrous ion levels
Ferrous iron uptake kinetics were measured as follows: WT and AhΔfeoB strains were grown overnight (16 h, 37°C) in M9 minimal medium. A 2 ml aliquot was collected as the 0 min baseline sample, then FeSO4 was supplemented to a final concentration of 0.2 mM. Additional 2 ml culture samples were harvested at 5, 10, 15, 20, 25, 30, and 35 min post‑iron exposure and at least three independent biological replicates were performed. Bacteria were harvested by centrifugation, washed twice with iron-free PBS to eliminate extracellular iron, and lysed via sonication. After removing cell debris by centrifugation, clear supernatants were collected for intracellular ferrous ion measurement using the Ferrous Ion Content Assay Kit (Solarbio, BC5415), following the manufacturer’s instructions. At least three independent biological replicates were performed. A parallel Fe2+ standard curve was generated in each assay to calculate absolute Fe2+ concentrations of cell lysates (Fig. S6). Intracellular Fe2+ content was normalized to total protein quantified by the BCA kit (BCA standard curve, Fig. S7). Final Fe2+ levels were presented as pmol Fe2+ per mg total protein.
For determining intracellular ferrous ion levels, WT, AhΔfeoB, and CΔfeoB were cultivated in M9 minimal medium supplemented with 0.2 mM FeSO4. Bacteria were harvested at log-phase by centrifugation, washed with iron-free PBS and lysed via sonication. Supernatants were collected for intracellular ferrous ion measurement. At least three independent biological replicates were performed. Final intracellular Fe2+ levels were presented as nmol Fe2+ per mg total protein.
Detergent sensitivity and oxidative stress assays
For sodium deoxycholate tolerance assays, strains were cultured in LB medium to an OD600 of approximately 0.9 and harvested by centrifugation. The cells were then washed twice with phosphate-buffered saline (PBS), resuspended in either 0.5% sodium deoxycholate or PBS and incubated at 37°C for 2 h, then serially diluted and plated on LB agar to determine viable cell counts. Survival rates were calculated as the ratio of CFUs obtained from treated groups to those from PBS controls (Li et al., 2022).
For oxidative stress resistance, 100 μl aliquots of bacterial cultures (OD600 ≈ 1.0) were evenly spread on the LB agar plates. Sterile filter paper disks containing 15 μl 1 M H2O2 were placed onto the agar surface. The inhibition zone diameters were measured after incubation to evaluate sensitivity to oxidative stress (Chen et al., 2023).
Antibiotic susceptibility testing and determination of minimum inhibitory concentration (MIC)
Antibiotic susceptibility was assessed via Kirby–Bauer disk diffusion method using 25 antibiotics, including cefazolin, penicillin, ampicillin, novobiocin, sulfamethoxazole/trimethoprim, acetylspiramycin, vancomycin, teicoplanin, polymyxin B, streptomycin, gentamicin, amikacin, neomycin, ofloxacin, norfloxacin, levofloxacin, enrofloxacin, clindamycin, erythromycin, tetracycline, florfenicol, minocycline, doxycycline, lincomycin, and meropenem (Lo Sciuto et al., 2014; Matuschek et al., 2018). The clindamycin minimum inhibitory concentration (MIC) was further determined under normal and iron-limited (DIP-treated) conditions.
Biofilm formation assay
Biofilm formation ability was quantified by crystal violet staining method in 24-well polystyrene plates (Liu et al., 2019). WT, AhΔfeoB, and CΔfeoB strains were prepared and harvested in LB medium, then washed with PBS. 500 µl of the bacterial suspension (OD600 = 0.2) was dispensed into 24-well plates, following static incubation at 30°C for 36 h. Sterile LB medium was used as a negative control. Non-adherent cells were eliminated by PBS washing. The remaining biofilms were fixed with 800 µl methanol for 30 min, followed by washing with distilled water and air-dried at 60°C for 1 h. 500 µl of 1% (w/v) crystal violet solution was added to each well and incubated for 15 min. Excess dye was removed by washing, followed by drying the plates at 60°C for 30 min. The stained biofilms were dissolved in 500 µl of 33% (v/v) glacial acetic acid, and absorbance was detected at 590 nm using a SpectraMax 190 microplate reader (Molecular Devices Corp., USA).
Acridine orange staining
WT and AhΔfeoB overnight cultures were diluted to an OD600 of 0.2 in LB medium. A volume of 500 µl of the adjusted bacterial suspension was then added to 6-well polystyrene plates containing sterile glass coverslips. After incubation, the biofilms were gently washed with PBS, fixed with methanol, and air-dried. The samples were subsequently stained with a 100 μg/ml acridine orange in the dark for 30 min. Biofilms were examined using a Leica DM6 fluorescence microscope at 40× magnification. At least three images were captured from randomly selected fields on each coverslip (Conway et al., 2019).
Transmission electron microscopy (TEM) observation
Transmission electron microscopy (TEM) analysis was performed as previously described (Seike et al., 2021) with minor modifications. Briefly, bacterial cells were collected by centrifugation at 3,000 × g for 5 min and subsequently washed twice with sodium cacodylate buffer. The suspension was then applied to carbon-coated copper grids, negatively stained with 2% (w/v) uranyl acetate and air-dried. Ultrastructural morphology was observed using a transmission electron microscope (H 600, Hitachi, Japan).
RNA isolation, reverse transcription, and quantitative real-time PCR
Quantitative real-time PCR (qRT-PCR) analysis was performed to evaluate gene expression profiles as previously described (Gong et al., 2024). The transcription levels of feoB, five biofilm-associated genes, and 15 virulence-related genes were quantified by qRT-PCR with 16S rRNA as the internal reference. The primers are listed in Table S2. The biofilm-associated genes analyzed included methylthioadenosine/S-adenosylhomocysteine nucleosidase genes (mtnN-1 and mtnN-2) and quorum-sensing-related genes (luxR, ahyR, and ahyI). The selected virulence-associated genes comprised flagellar and pilus-related genes (flgE, flgL, and pilB), a pilin subunit gene (cblA), type VI secretion system-related genes (vasH and traA), a type III secretion system gene (ascV), a serine peptidase gene (degQ), toxin-related genes (aerA and hlyA), outer membrane protein genes (ompA and ompTS), a two-component regulatory gene (ompR), a lipopolysaccharide biosynthesis gene (rfaF), and 4-amino-4-deoxychorismate lyase (ADCL).
Total RNA was extracted and its concentration was quantified before cDNA synthesis. First-strand cDNA was generated using the FastQuant RT Kit (with gDNase) (Tiangen, China). Quantitative PCR was conducted using SYBR Green I on an ABI 7500 Real-Time PCR system (Applied Biosystems, USA). Each reaction was performed in a final volume of 10 μl under the following cycling conditions: initial denaturation at 95°C for 20 s, followed by 45 cycles of 95°C for 20 s, 55°C for 20 s, and 72°C for 20 s (Chen et al., 2025). Relative mRNA expression was calculated using ABI 7500 software (version 2.0.6). Each experiment was conducted with five independent replicates. The 16S rRNA was used as the reference housekeeping gene, and no-template negative controls were run in parallel. The expression stability of 16S rRNA in different strains were analyzed using RefFinder, an online tool for the comprehensive evaluation of RGs. RefFinder integrates four widely used algorithms—ΔCt, geNorm, NormFinder, and BestKeeper to assess the stability of reference genes (Xie et al., 2023).
Gene expression levels were normalized to the 16S rRNA via the 2-ΔΔCT method. Primer amplification efficiencies were determined by standard curve analysis, with all efficiencies ranging from 90% to 110% (Bustin et al., 2009).
Determination of AhΔfeoB virulence in a mouse model
Female BALB/c mice (4–6 weeks old) were used to evaluate bacterial virulence. The bacteria were cultured in LB medium at 37°C to the log phase, then centrifuged, washed twice with sterile saline, and adjusted to the desired concentration based on OD600 values. Mice were grouped into six groups of five and intraperitoneally injected with 1.0 ml of bacterial suspension containing 0.5 × 10⁷ to 2.5 × 10⁷ CFU/ml prepared in sterile Dulbecco’s phosphate-buffered saline (DPBS). Survival rates were monitored daily for 14 days (Liu et al., 2019). The virulence of the WT and AhΔfeoB strains was assessed by determining the 50% lethal dose (LD50).
Protein sample preparation
Bacterial cultures were inoculated into 10 ml of LB medium at a 1:100 (v/v) ratio and incubated at 30°C until the OD600 reached approximately 1.0. Cells were harvested and washed three times with PBS. The cell pellets were then resuspended in 0.1 ml lysis buffer containing 8 M urea in 100 mM Tris–HCl (pH 8.5). Cell disruption was achieved through repeated freeze–thaw cycles followed by sonication (30 s pulses at 20% amplitude for five cycles). The lysates were subsequently centrifuged at 18,000 × g for 15 min at 4°C, and the supernatants were collected for further analysis. Protein concentration was determined using the Bradford method (Reddy et al., 2024). For proteomic analysis, proteins were reduced with 10 mM dithiothreitol at 37°C for 30 min, alkylated with 20 mM iodoacetamide at 25°C for 45 min in the dark and digested with trypsin at a ratio of 1:100 (w/w) at 37°C for 12 h. Peptides were desalted using a C18 solid-phase extraction column (CNW, Anpel, China). Subsequently, peptide concentrations were normalized using a BCA Protein Assay Kit (Pierce, USA) and qualified by liquid chromatography–mass spectrometry (LC–MS; Thermo Fisher Scientific, USA) prior to proteomic analysis (Agwunobi et al., 2022).
Data-independent acquisition (DIA) proteomics analysis
Data-independent acquisition (DIA) proteomics was performed on a high-resolution mass spectrometry platform (Wang et al., 2022). Protein samples were reconstituted in solvent A (99.9% H2O, 0.1% formic acid) supplemented with indexed retention time (iRT) peptides (Biognosys, Switzerland). DIA-based quantitative analysis was performed on a VanquishTM Neo UHPLC system coupled to an Orbitrap Exploris 480 mass spectrometer (Thermo Fisher Scientific, USA).
Samples were initially loaded onto a C18 reverse-phase trap column (5 μm particle size, 300 μm inner diameter × 5 mm length; PEPMAP NEO, Thermo Fisher) and subsequently separated on a C18 analytical column (1.5 μm particle size, 75 μm inner diameter × 250 mm length; Waters, USA) at a flow rate of 300 nl/min. Peptides were ionized via electrospray in positive ion mode at 2,300 V and analyzed under DIA acquisition settings.
Raw mass spectrometry data were processed using Spectronaut software (version 18.0; Biognosys, Switzerland) with default parameters, and a false discovery rate (FDR) threshold of < 1%. Protein identification was based on the A. hydrophila ATCC 7966 protein database derived from transcriptomic sequencing (NCBI accession: NC_008570.1).
Differentially expressed proteins (DEPs) were defined as those exhibiting a fold change (FC) > 1 or < 0.667 and a P value of < 0.05. Functional annotation and enrichment analyses were conducted using the Majorbio Cloud platform (https://cloud.majorbio.com). All proteomic data are provided in Table S1.
Statistical analysis
All statistical analyses were conducted using GraphPad Prism 8.0. Differences between two groups were analyzed using Student’s t-test, while one-way analysis of variance (ANOVA) was applied for multiple-group comparisons. Survival data and LD50 values were analyzed via the log-rank test. Statistical significance was defined as *P < 0.05, **P < 0.01, and ***P < 0.001.
Results
Effects of feoB mutation on the hemolytic and motility activity of A. hydrophila
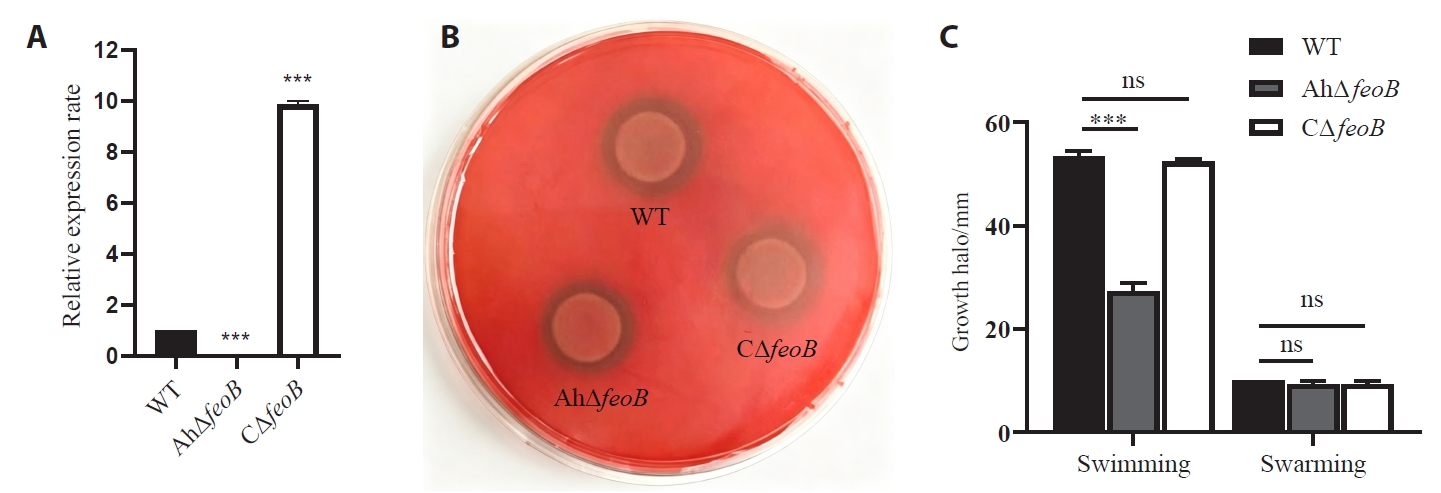
The qRT-PCR results confirmed that the feoB gene was not expressed in AhΔfeoB, but was expressed in both the wild-type (WT) and complemented strains (CΔfeoB). It showed that AhΔfeoB and CΔfeoB were successfully constructed (Fig. 1A). Hemolysin is an important virulence factor in many aquatic bacteria. All strains displayed equal α-hemolytic activity on sheep blood agar (Fig. 1B). The swimming diameter of the WT was approximately twice that of AhΔfeoB (27 mm). However, the swarming capacity of AhΔfeoB showed no significant difference compared with WT. The motility phenotype was restored in the CΔfeoB strains (Figs. 1C and S1).
The feoB gene does not affect the growth of A. hydrophila
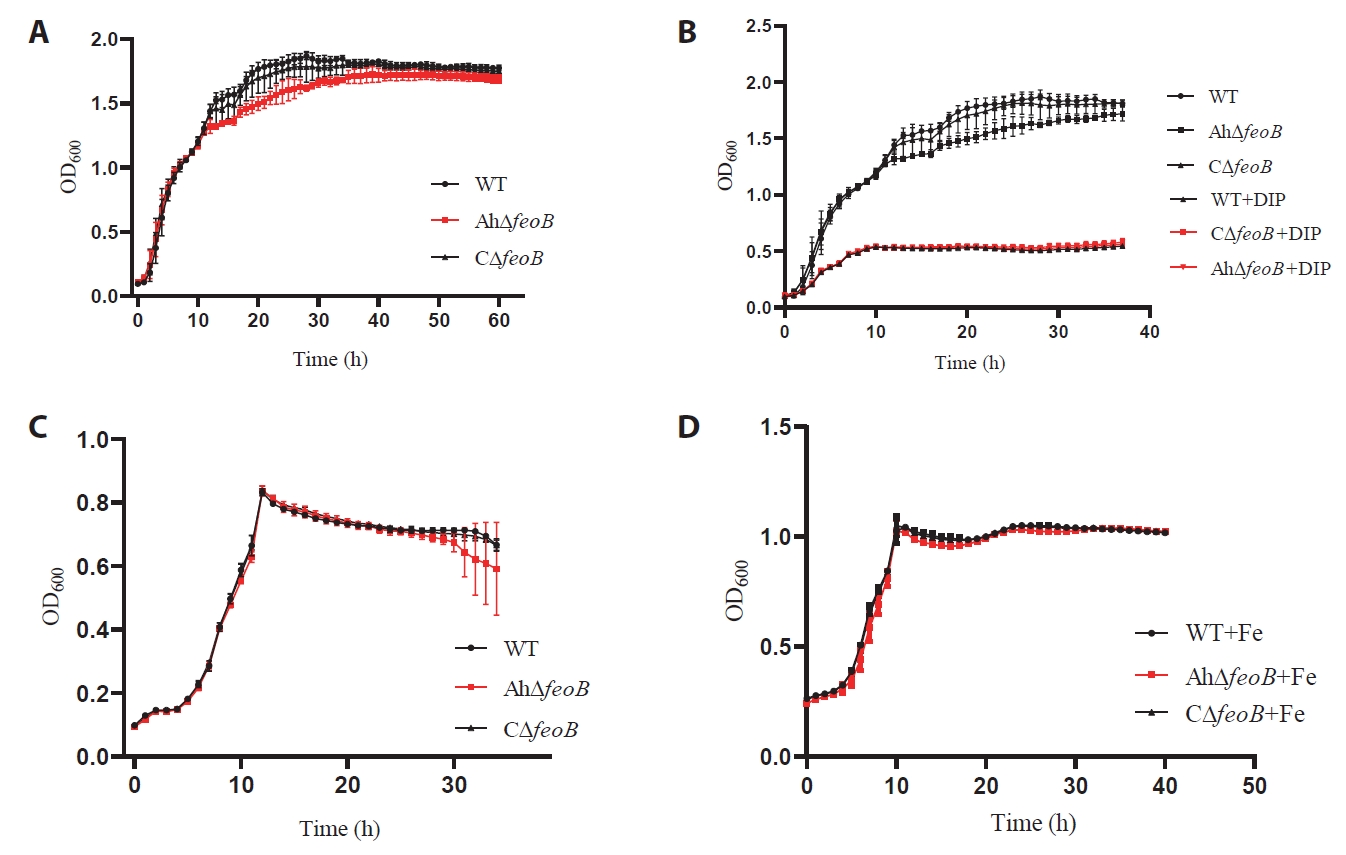
In standard LB medium, the WT strain showed a typical growth curve, with a short lag phase (0–2 h), followed by a log phase during which major bacterial growth occurred (2–15 h) and then a stationary phase (15–40 h). The AhΔfeoB showed a slightly reduced growth rate during the exponential phase but ultimately reached CFU levels comparable to those of the WT strain at the stationary phase. The growth rate of the complemented strain CΔfeoB was consistent with that of the WT. In LB medium supplemented with 0.6 mM 2,2'-dipyridyl (DIP), the growth of all strains was inhibited, with peak OD600 values reduced to approximately 0.5. No significant differences were observed in growth curves (Fig. 2A and 2B).
In M9 minimal medium, all strains exhibited lower peak OD600 values and entered a gradual decline in the late growth phase after 20 h (Fig. 2C). Supplementation of exogenous iron (0.2 mM FeSO4) restored consistent growth profiles across the three strains with peak OD600 of 1.0 and no evident decline in the stationary phase (Fig. 2C and 2D).
Deletion of feoB affects ferrous iron transport in A. hydrophila
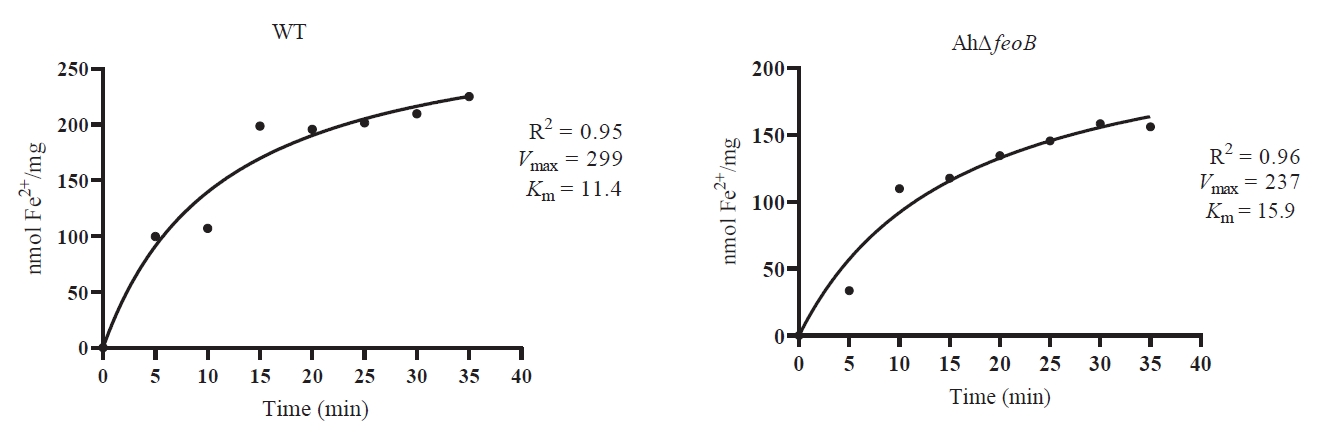
To investigate the function of feoB in ferrous iron acquisition of A. hydrophila, Fe2+‑uptake kinetics were determined for WT and AhΔfeoB by Michaelis‑Menten fitting (Fig. 3). The WT exhibited a Vmax of 299 nmol Fe2+ mg-1 protein and Km of 10.26, whereas the AhΔfeoB exhibited a reduced Vmax of 237 nmol Fe2+ mg-1 protein and elevated Km of 15.9. These data indicate that deletion of feoB diminished both the maximal transport capacity and substrate affinity for Fe2+. Nevertheless, substantial Fe2+ uptake was still detectable in AhΔfeoB, implying the existence of additional ferrous‑iron acquisition systems.
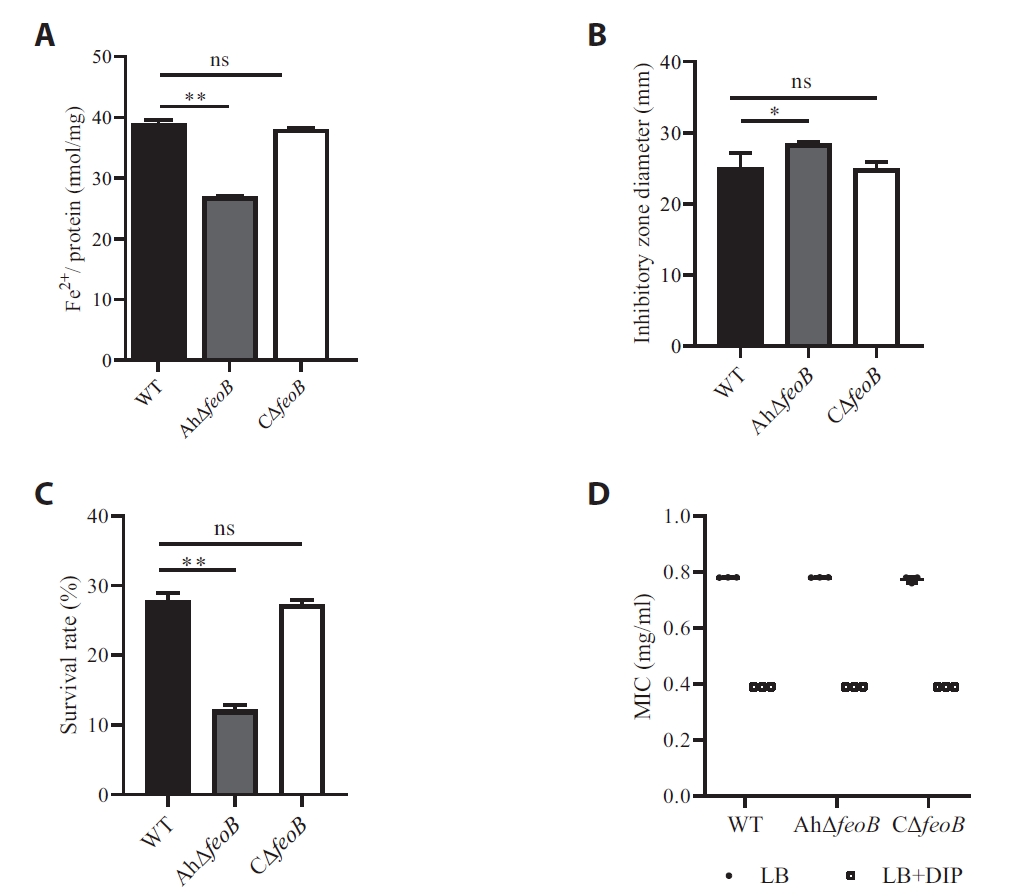
The WT had an intracellular ferrous iron concentration of 62.1 nmol, significantly elevated relative to AhΔfeoB (43.1 nmol) at log-phase. The CΔfeoB recovered ferrous iron accumulation comparable to WT (Fig. 4A). These findings verify that feoB fulfills an important role in physiological ferrous iron uptake by A. hydrophila.
Deletion of feoB affects envelope integrity in A. hydrophila
Bacterial sensitivity to oxidative stress and membrane-disrupting agents was evaluated using hydrogen peroxide and sodium deoxycholate assays. The inhibition zone diameter of AhΔfeoB under H2O2 oxidative stress was larger than that of the WT strain and the phenotype was restored in the CΔfeoB strains (Fig. 4B). These results indicated that AhΔfeoB was more sensitive to oxidative stress. Ionic detergents, such as sodium deoxycholate, are effective in solubilizing both cytoplasmic and nuclear cellular membranes. The results showed that AhΔfeoB was more susceptible to 0.5% sodium deoxycholate than the WT strain (Figs. 4C and S2). These results indicate that feoB is required to maintain membrane integrity and envelope integrity in A. hydrophila.
Role of feoB on antibiotic sensitivity of A. hydrophila
Compared to WT, AhΔfeoB mutant exhibited increased sensitivity to several antibiotics. AhΔfeoB susceptibility to gentamicin shifted from Resistant (R) to susceptible (S), while susceptibility to streptomycin and neomycin changed from R to intermediate (I); susceptibility to enrofloxacin was altered from intermediate (I) to susceptible (S). Notably, the AhΔfeoB mutant exhibited a 15 mm increase in the clindamycin inhibition zone (Table 2). The MIC assay showed that deletion of the feoB gene increased sensitivity to clindamycin, alongside reduced MIC from 0.78 mg/ml to 0.39 mg/ml under both iron-replete and DIP-induced iron-limited conditions (Fig. 4D). Although the response was categorized as resistant based on the clinical breakpoint (≤ 19 mm for resistant), this marked phenotypic improvement suggested that impaired ferrous transport likely increases membrane permeability and weakens stress tolerance, restoring partial clindamycin susceptibility.
Deletion of feoB affects biofilm formation
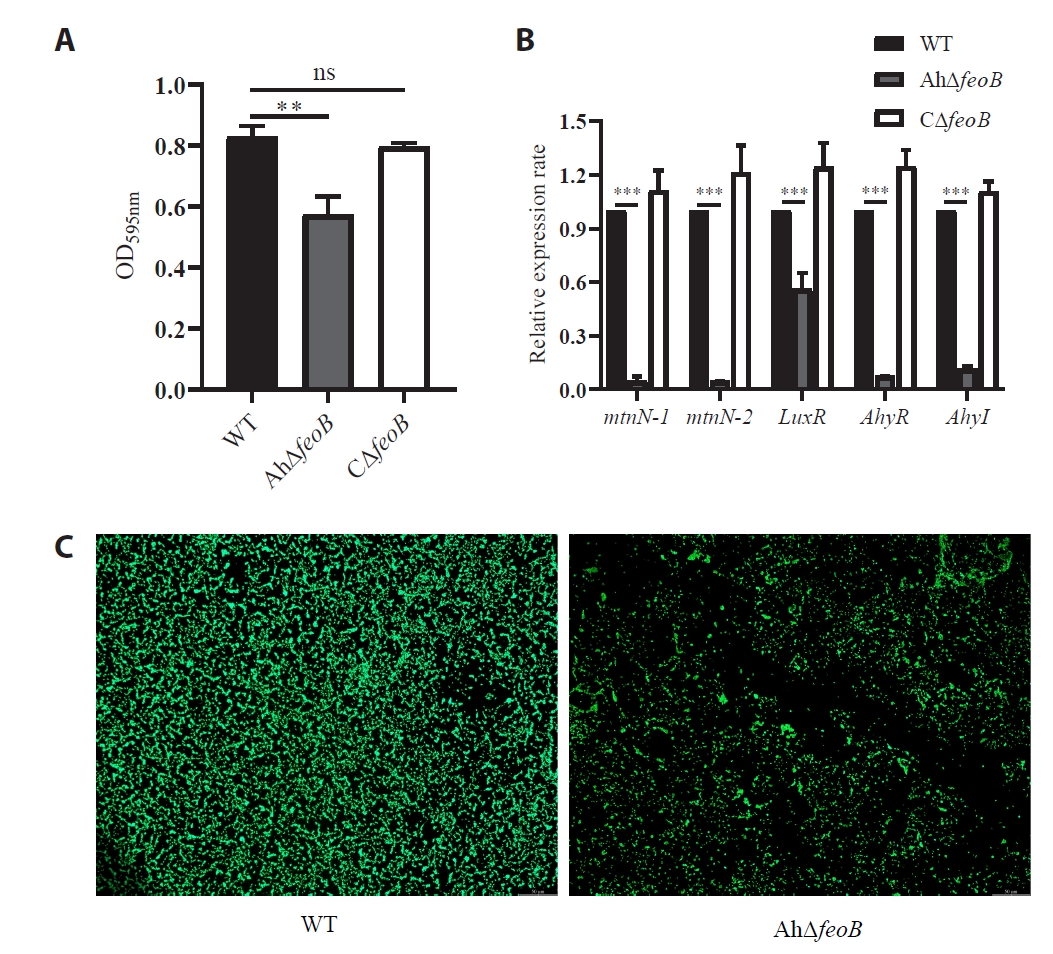
The results indicated that AhΔfeoB formed significantly less biofilm than the WT, suggesting an overall positive effect of feoB on biofilm formation. The biofilm formed by CΔfeoB restored the parental phenotype (Figs. 5A and S3). The effect of feoB gene deletion on the expression levels of biofilm-associated genes were significant downregulation of mtnN-1, mtnN-2, luxR, ahyR, and ahyI in AhΔfeoB (Fig. 5B). As observed under a fluorescence microscope, the WT strain formed a thick, dense, well-organized biofilm on the glass surface. In contrast, the AhΔfeoB mutant formed a much thinner, loosely organized biofilm, indicating that deletion of feoB significantly inhibited biofilm formation (Fig. 5C).
Morphological characterization of A. hydrophila
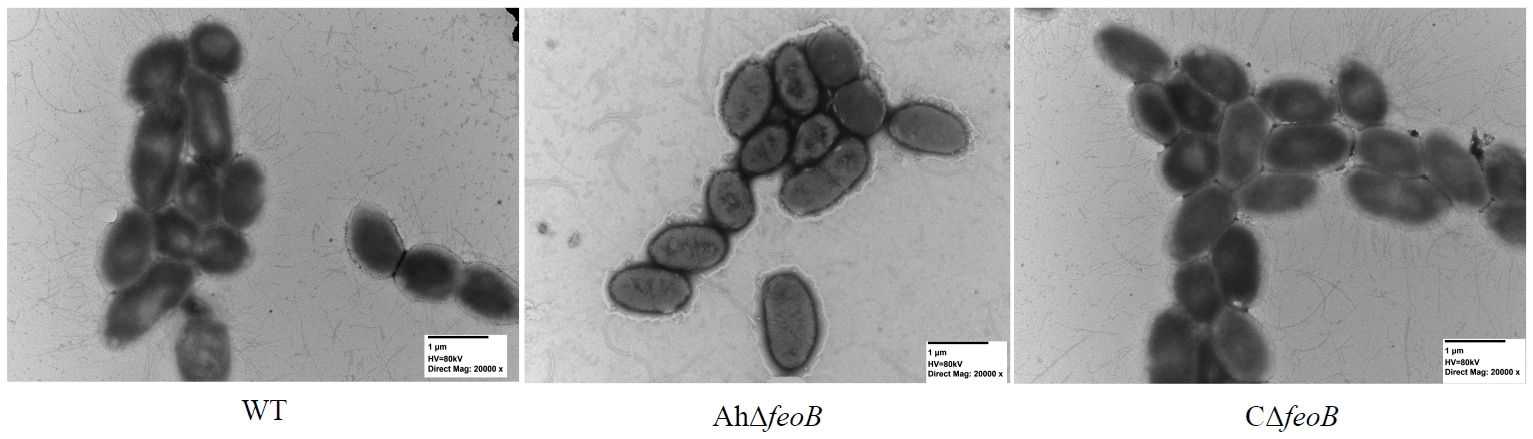
The effect of feoB deletion on the cellular morphology of A. hydrophila was examined by TEM, which revealed that WT cells were rod-shaped, tightly packed, and uniform in morphology. Though AhΔfeoB cells retained normal morphology, cells aggregated more loosely and displayed drastically fewer incomplete flagella. Additionally, pili density was markedly decreased with irregular distribution. Numerous outer membrane vesicles of variable sizes were clearly observed around the outer membrane of AhΔfeoB cells. Many of these vesicles appeared to bud or pinch off from the cell surface, often connected to the outer membrane by thin filamentous structures. The morphology of CΔfeoB restored the parental phenotype (Fig. 6). Collectively, feoB deletion disrupts normal structure of the bacterial cell envelope.
Quantitative real-time PCR analysis
Stability analysis of 16S rRNA in different strains were analyzed using RefFinder. ΔCt analysis showed that 16S rRNA was most stable in AhΔfeoB (SD = 0.53), followed by WT (SD = 0.68) and CΔfeoB (SD = 0.80). BestKeeper ranked stability as CΔfeoB (0.3) > AhΔfeoB (0.35) > WT (0.48). GeNorm gave the lowest M‑value (0.41) for WT and AhΔfeoB, and the highest M‑value (0.67) for CΔfeoB. NormFinder offer the ranking: AhΔfeoB (0.2) > WT (0.58) > CΔfeoB (0.76). Collectively, 16S rRNA was stably expressed among tested strains and qualified as a qRT‑PCR reference gene.
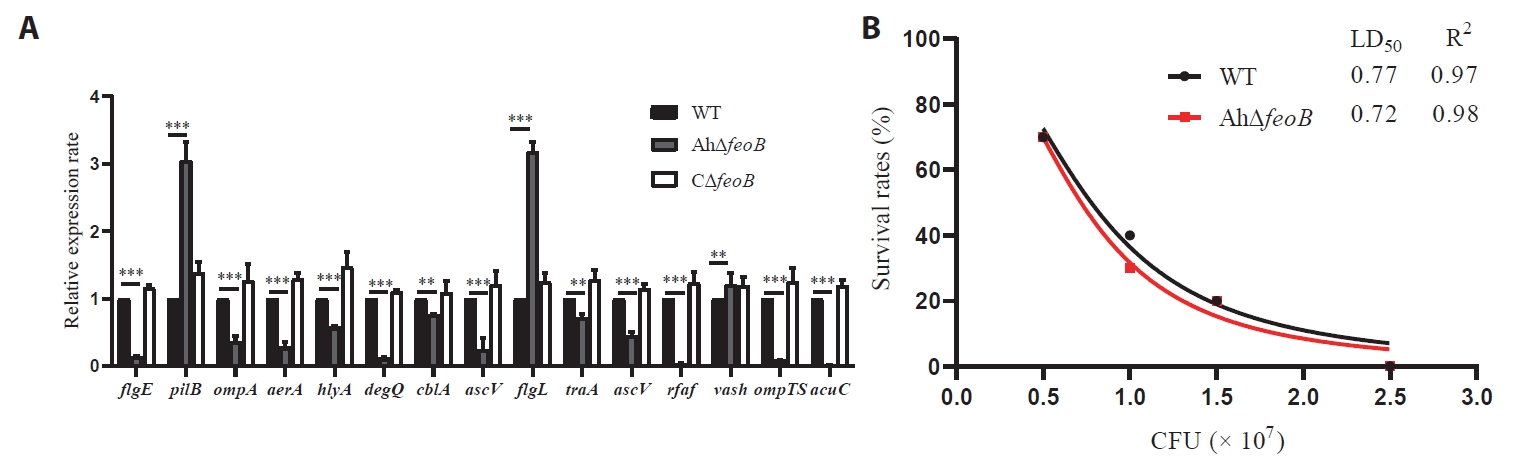
The transcriptional levels of 15 virulence-associated genes were detected. In AhΔfeoB, 12 genes (aerA, degQ, ompA, flgE, ompTS, hlyA, rfaF, traA, cblA, acuC, and ascV) were significantly downregulated. By contrast, the expression of vasH, pilB and flgL were significantly upregulated. There is no significant difference between the WT and CΔfeoB regarding the expression of these genes (Fig. 7A).
Pathogenesis in the BALB/c mouse model
The 14-day mouse infection assay showed similar mortality and lethal dose (LD50) between WT (0.77 × 10⁶ CFU/ml) and AhΔfeoB (0.72 × 10⁶ CFU/ml), indicating that feoB deletion did not alter the lethal pathogenicity of A. hydrophila (Fig. 7B).
Data-independent acquisition (DIA)-based proteomics result
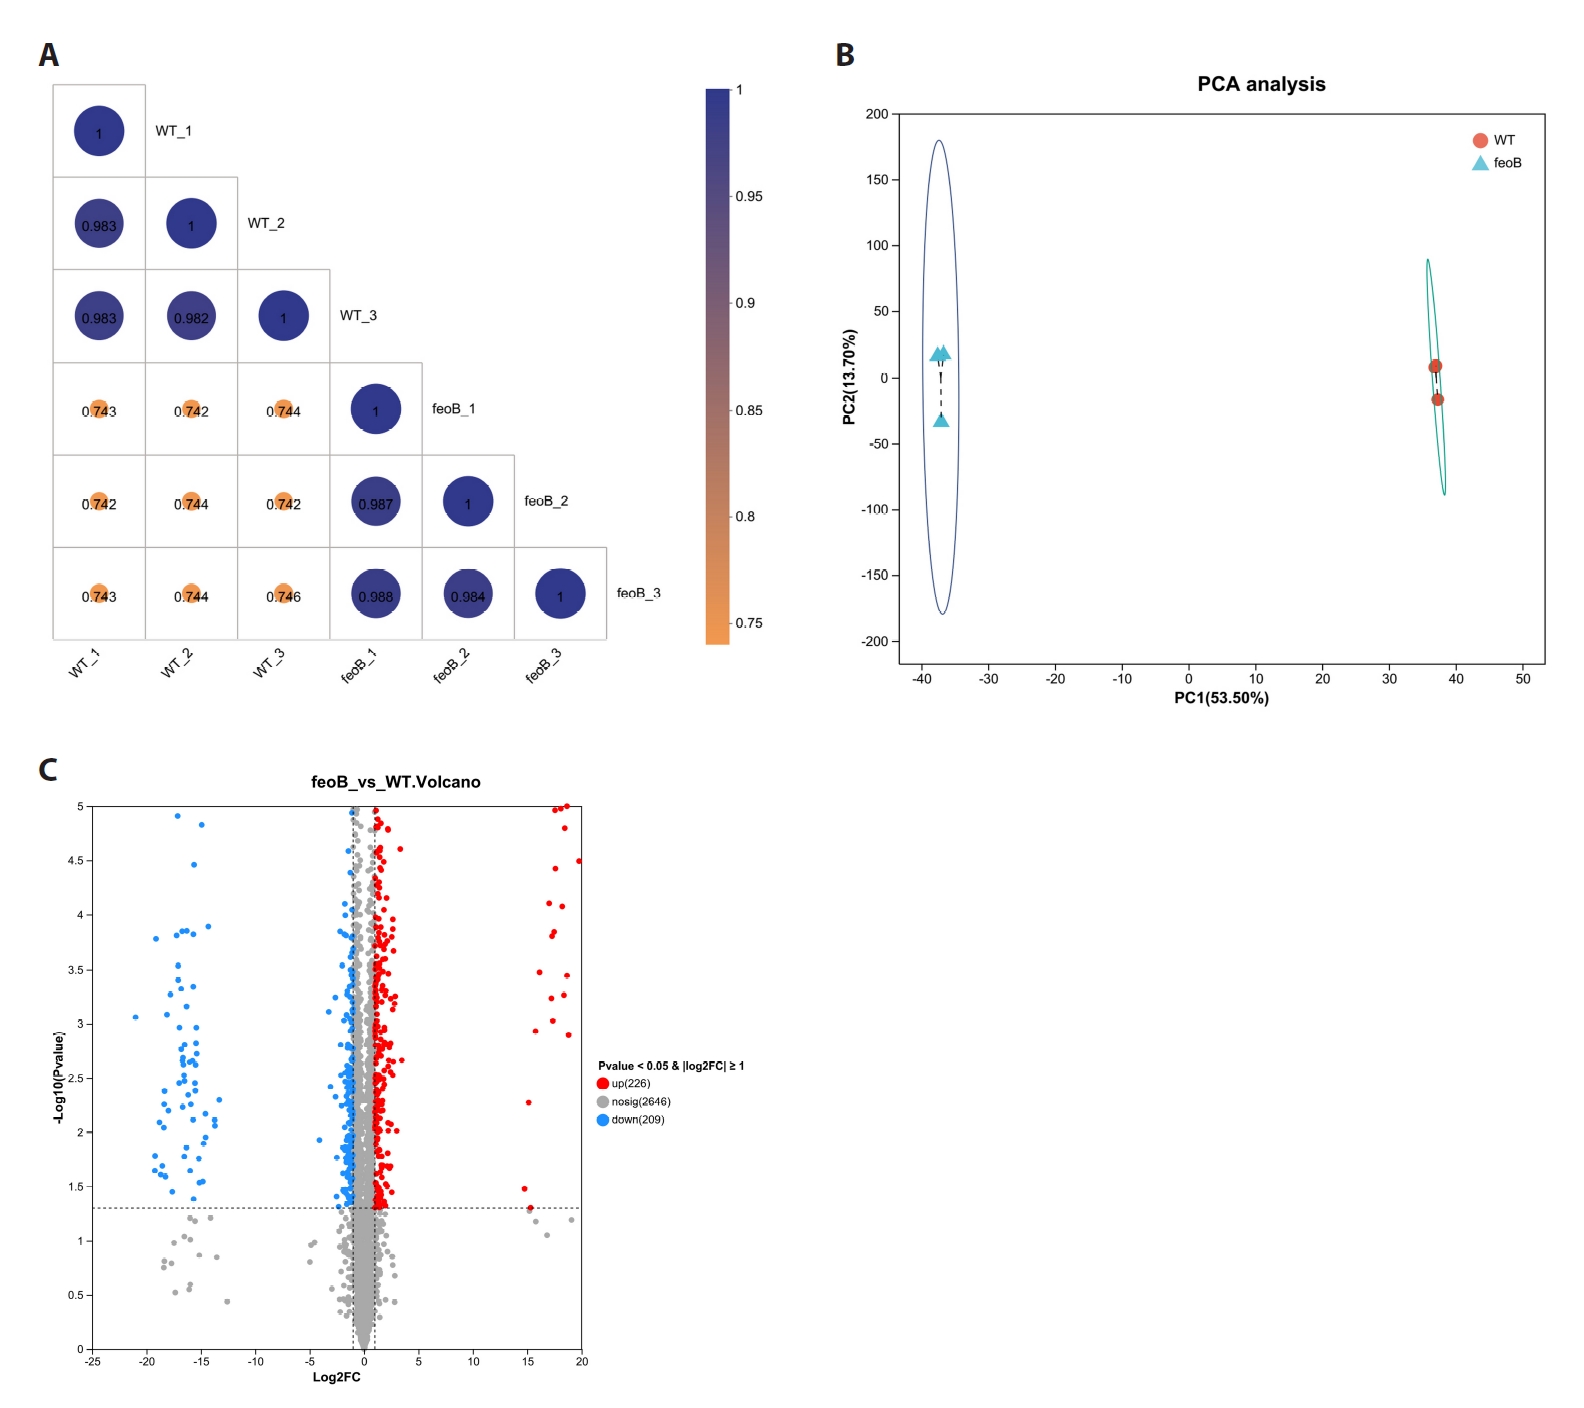
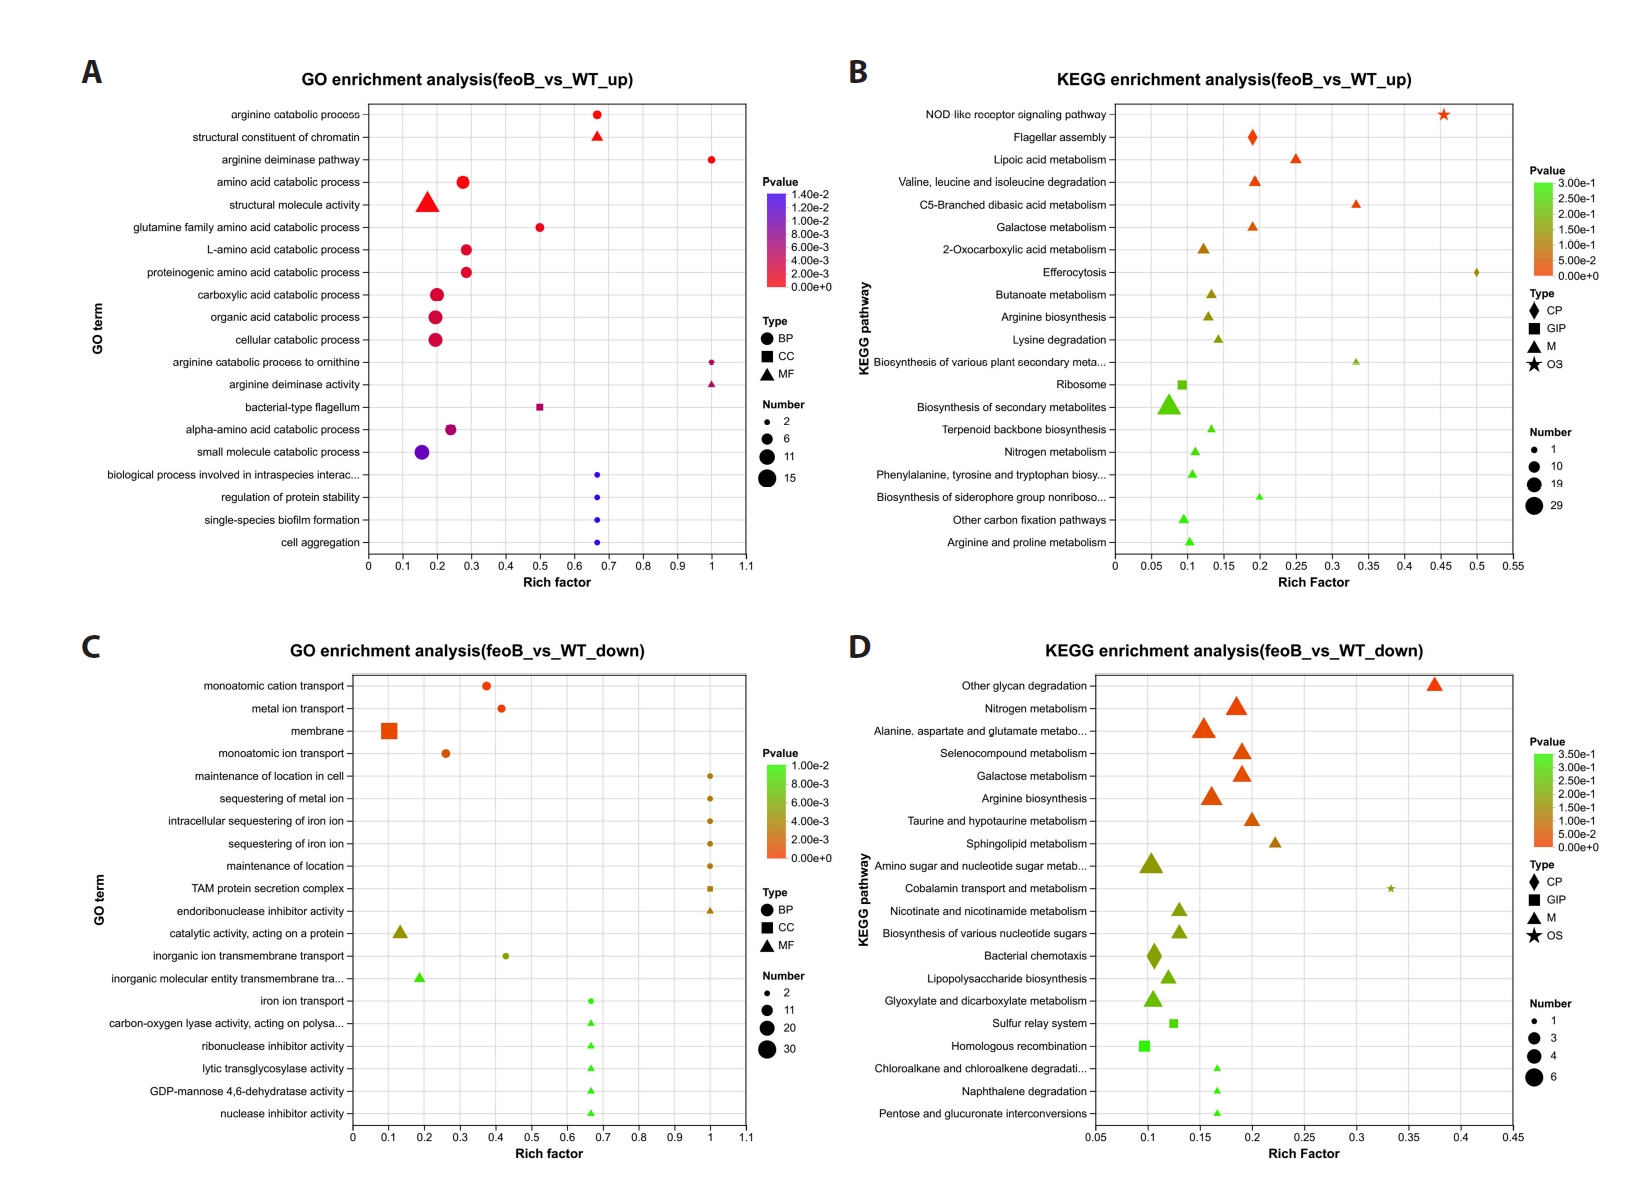
The mass spectrometry proteomics data have been deposited to the ProteomeXchange Consortium (https://proteomecentral.proteomexchange.org) via the iProX partner repository with the dataset identifier IPX0018386000. Protein intensities across three biological replicates showed high reproducibility (Pearson's r > 0.9), suggesting the reliability of the proteomics data (Fig. 8A). Principal component analysis (PCA) analysis revealed distinct proteomic profiles between WT and the feoB mutant with PC1 accounted for 53.5% of total variance, and PC2 accounted for 13.70%. Volcano plot identified 435 differentially expressed proteins (DEPs) (FC > 1 and p-value < 0.05) in AhΔfeoB, including 226 upregulated and 209 downregulated proteins (Figs. 8B, 8C, and S4).
Cluster analysis of DEPs
The DEPs were categorized into ten expression clusters. The most significant pathway was cluster C9 including arginine deiminase and catabolic processes, oxidoreduction−driven active transmembrane transporter activity, structural constituent of chromatin, proton and inorganic molecular transmembrane transporter activity and glutamine family amino acid catabolic process. The enrichment analysis results were all statistically significant (P < 0.001) (Fig. S5).
GO enrichment analysis of DEPs
The DEPs between WT and the feoB group were categorized into three main domains: biological process (BP), molecular function (MF), and cellular component (CC). In the BP pathway, amino acid catabolism was significantly enriched, indicating that amino acid catabolism served as the core function following feoB deletion. Terms such as carboxylic acid catabolism, organic acid catabolism, and cellular catabolism were also highly enriched, demonstrating a global enhancement of catabolism. In the MF pathway, the terms of structural constituents of chromatin and structural molecule activity were significantly enriched, suggesting important changes in chromatin structure and cytoskeleton. In the CC pathway, the term of bacterial flagellum was significantly enriched, indicating upregulation of flagellar structure-related proteins, which may be associated with bacterial changes in motility and biofilm formation (Fig. 9A).
The downregulated proteins were shown in Fig. 9B. In the BP pathway, terms related to metal ion (especially ferrous ion) transmembrane transport were significantly enriched and suppressed. Meanwhile, terms such as maintenance of location in cell, sequestering of metal ion, intracellular sequestering of iron ion, and sequestering of iron were also highly enriched. This result is directly related to the function of feoB as a ferrous iron transporter, indicating metal ion transport and intracellular localization constitute the core function of feoB. In the MF pathway, protein catalytic activity and inorganic ion transmembrane transport were significantly weakened. Additionally, enzyme activity-related terms were enriched, indicating that nucleic acid metabolism and cell wall remodeling processes were also downregulated. In the CC pathway, the terms of membrane and TAM protein secretion complex were significantly enriched, indicating that the expression of membrane-related components and the protein secretion system were generally repressed. These terms were directly related to the membrane transport functions.
KEGG enrichment analysis of DEPs
KEGG metabolic pathway enrichment analysis revealed metabolic (M) pathways were predominantly enriched, with amino acid and energy metabolism emerging as core upregulated functions. In particular, the arginine and proline metabolism pathway was the most highly enriched pathway containing the largest number of DEPs. This result confirmed the central role of arginine metabolism in the strain's adaptation to iron-deficient environments. Secondary metabolite biosynthesis showed the highest enrichment factor, activated to counter iron-limited stress. Other metabolic pathways were also significantly enriched, suggesting systematic reconstruction of the strain's global metabolic network, particularly amino acid and energy metabolism. The Cellular Processes (CP) pathway including bacterial motility, signal transduction and flagellar assembly were also enhanced, representing an adaptive strategy for nutrient acquisition in iron-deficient environments. The upregulation of NOD-like receptor and stress response signaling suggested activation of innate immunity and response to cellular stress induced by iron deficiency (Fig. 9C).
As shown in Fig. 9D, in the M pathway, amino acid and carbohydrate metabolism were significantly downregulated, indicating polysaccharide degradation and carbohydrate metabolism processes were strongly inhibited. Contrasting activated amino acid catabolism, nitrogen metabolism and amino acid synthesis declined, indicated that the core energy production and carbon metabolism networks underwent global reconstruction. In the CP pathway, suppressed chemotaxis weakened chemotactic and motion-sensing capabilities. The inhibited lipopolysaccharide biosynthesis compromised membrane integrity and environmental fitness. The homologous recombination was downregulated, suggesting that DNA recombination and repair processes were inhibited, potentially affecting the strain's genomic stability. In Organismal Systems (OS), repressed cobalamin (vitamin B12) transport and metabolism pathway correlated with impaired metal ion trafficking.
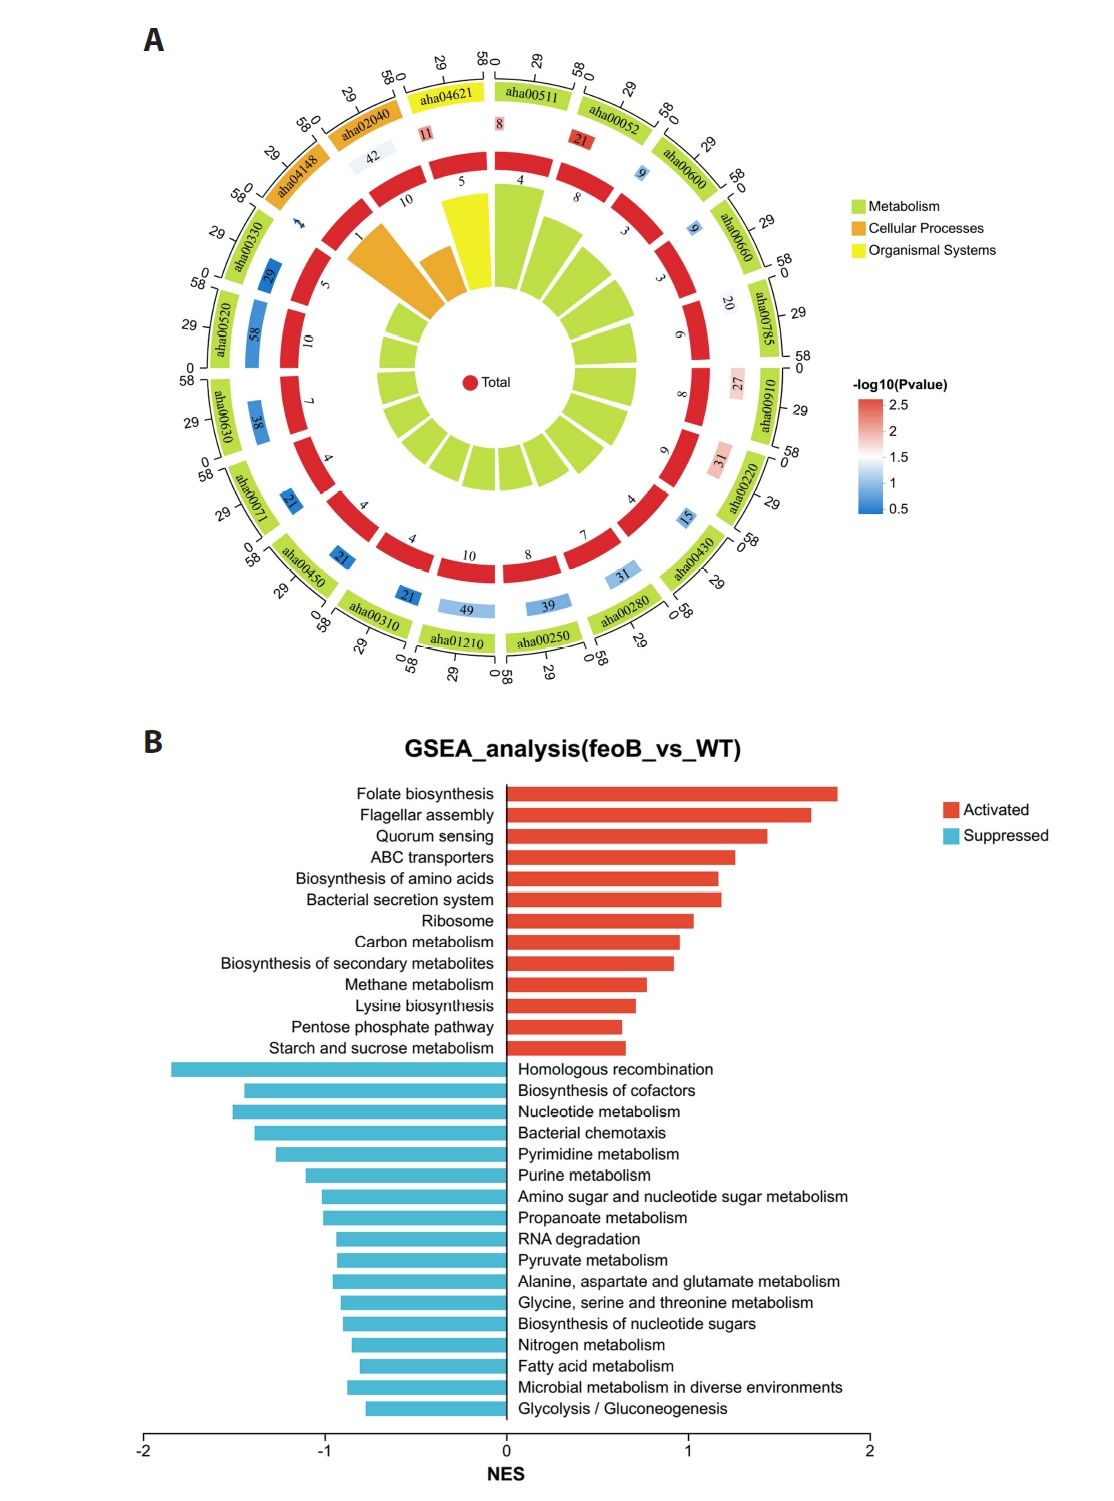
Circular enrichment analysis of DEPs
The circular enrichment plot categorized DEPs into three functional groups: Metabolism, Cellular Processes, and Organismal Systems. The metabolic-related classifications dominated the DEP distribution, with arginine and proline metabolism (aha00330, 49 proteins) and alanine, aspartate and glutamate metabolism (aha00250, 39 proteins) as the most enriched modules, indicating metabolism as the core regulatory pathway. Several metabolic-related pathways exhibited extremely high enrichment significance (P < 0.01), suggesting profound metabolic perturbations in the AhΔfeoB.
Protein expression patterns differed markedly across functional categories: metabolic pathways were predominantly upregulated, while cellular processes including membrane transport and flagellar assembly were mostly downregulated. This expression pattern reflects an adaptive strategy of enhanced catabolism and repressed membrane transport under iron deficiency, which remodels bacterial resource allocation. The metabolic pathways showed higher Rich Factor values than other categories, further verifying that metabolic reprogramming serves as the central mechanism for AhΔfeoB to adapt to iron-limited conditions (Fig. 10A).
GSEA analysis of DEPs
Unlike GO/KEGG enrichment analysis that focuses on individual DEPs, Gene Set Enrichment Analysis (GSEA) can capture subtle but coordinated changes. GSEA results indicated that seven pathways were significantly upregulated in AhΔfeoB: Folate biosynthesis, Flagellar assembly, Quorum sensing, ABC transporters, Amino acid biosynthesis, Bacterial secretion system and Ribosome. Folate biosynthesis pathway was the most activated pathway, facilitating DNA synthesis, cell proliferation and biosynthesis. Activation of flagellar assembly and quorum-sensing pathways improves motility, group behavior and virulence. The activation of ABC transporters, secretion system and ribosomals enhance substance transport and protein synthesis. By contrast, thirteen central carbon metabolism pathways were repressed, revealing global inhibition of energy metabolism (Fig. 10B).
Overall, the feoB deletion reshapes the global regulatory network of A. hydrophila. Upregulated biosynthesis, motility, virulence and translation pathways maintain growth and adaptability, whereas suppressed energy metabolism reduces energy expenditure and remodels metabolism. This dual regulation enables A. hydrophila to survive disrupted under disrupted iron homeostasis.
Discussion
Iron is essential for the survival and metabolism of pathogenic bacteria, and iron homeostasis is strongly associated with bacterial virulence, environmental adaptation, and antimicrobial resistance. In Gram-negative bacteria, the Feo system is a major pathway for ferrous iron uptake and its component gene feoB is widely recognized as critical for iron acquisition and pathogenicity in many bacteria (Guan et al., 2025; Huang et al., 2023; Kammler et al., 1993; Naikare et al., 2006; Tsolis et al., 1996).
In this study, the feoB gene of A. hydrophila ATCC 7966 was successfully deleted via homologous recombination, generating AhΔfeoB mutant and its complemented strain. We further explored the biological role of feoB and global proteomic differences between the mutant and the wild-type (WT) strains. The results demonstrated that feoB participates in multiple regulatory processes in A. hydrophila, with functions different from those reported in other bacteria.
Iron acts as an essential cofactor for enzymatic reactions, DNA synthesis and repair, electron transport, oxidative phosphorylation, and various metabolic pathways (Strzelecki and Nowicki, 2025). Nevertheless, the growth rate of AhΔfeoB was consistent with that of the WT under iron-restricted conditions. This finding is consistent with previously reported studies on Campylobacter jejuni and Aeromonas veronii (Guan et al., 2025; Naikare et al., 2006), but contrasted with reports in Escherichia coli, Salmonella enterica, and Riemerella anatipestifer, in which feoB disruption leads to severe growth defects under iron limitation (Huang et al., 2023; Kammler et al., 1993; Tsolis et al., 1996).
Bacterial motility plays an essential role in survival, environmental adaptation, and pathogenicity. Motility assays showed that feoB deletion significantly inhibited swimming motility without obvious influence on swarming motility. Transmission electron microscopy revealed decreased flagellar density and structural abnormalities in the mutant, indicating that feoB-dependent iron-uptake supports normal flagellar assembly and motility. Similar results have been observed in A. veronii, where the ΔfeoB mutant exhibited impaired swimming ability, severe disruption of flagellar structure, and flagellar breakage, accompanied by downregulation of flagellar biosynthesis-related genes (Guan et al., 2025). Ferrous iron also serves as a regulatory signal to stimulate flagellar gene transcription and swimming motility in Stenotrophomonas maltophilia (Zhang et al., 2022). These data suggest that iron availability is required not only for the flagellar components synthesis but also to provide energy for motility.
The AhΔfeoB displayed increased susceptibility to H2O2-induced oxidative stress and sodium deoxycholate-mediated membrane damage, reflecting weakened cellular defense capacity. Similar phenotypes have been documented in other bacterial species (Guan et al., 2025; Wang et al., 2021). Conversely, feoB deletion decreased H2O2 susceptibility in R. anatipestifer, suggesting that iron-dependent stress responses are species-specific (Huang et al., 2023). Iron is an essential cofactor for antioxidant enzymes such as superoxide dismutase (SOD) and catalase. Consequently, disturbed intracellular iron balance reduces enzyme activity and raises oxidative stress susceptibility (Liu et al., 2025a; Nandi et al., 2019). TEM observation detected abundant outer membrane vesicle-like structures, reduced flagella and pili density and loosely arranged cells in AhΔfeoB cells. These structural changes indicated disruption of the cell envelope integrity, higher membrane permeability to external stressors. Alterations in membrane integrity may interfere with flagella and pili assembly, thereby further contributing to the enhanced mutant’s stress sensitivity.
Antibiotic susceptibility testing showed that feoB deletion moderately elevated bacterial sensitivity, confirming the linkage between bacterial iron transport systems and antimicrobial resistance. Aminoglycosides including streptomycin, gentamicin, and neomycin are widely used in aquaculture to control bacterial infections, whereas enrofloxacin is commonly used to treat A. hydrophila-associated diseases (Wainwright, 1991; Zhang et al., 2024). The bactericidal efficacy of these antibiotics depends largely on active cellular metabolism, disrupted iron homeostasis disturbs energy production and protein synthesis, alter membrane permeability and consequently influencing antibiotic susceptibility (Guan et al., 2025; Pan et al., 2023; Zhu et al., 2017). Although AhΔfeoB remained clinically resistant to clindamycin, the reduction in MIC indicates partial susceptibility increase. Clindamycin mainly targets Gram-positive bacteria and anaerobes with limited efficacy against most Gram-negative organisms, including Aeromonas spp. (Zdanowicz et al., 2020). Two reasons may explain this change: firstly, compromised membrane integrity facilitates antibiotic penetration and intracellular accumulation; secondly, disruption of iron homeostasis may impair stress response pathways and metabolic capacity, lowering bacterial tolerance to antibiotics.
Biofilm formation is a vital virulence trait of A. hydrophila, facilitating adhesion, colonization and stress resistance (Zhao et al., 2022). Our study found that feoB deletion markedly suppressed biofilm formation, AhΔfeoB formed thinner, less structured biofilms compared with the WT strain. Consistently, feoB disruption also inhibits biofilm development in A. veronii and Legionella pneumophila (Guan et al., 2025; Lopez et al., 2023), implying a conserved correlation between iron acquisition and biofilm formation across bacterial species (Oliveira et al., 2021). Iron availability is a key determinant of biofilm development and biofilm maturation is severely disrupted upon feoB deletion.
Correspondingly, multiple biofilm-associated genes were significantly downregulated in AhΔfeoB. These genes participate in quorum sensing, nucleoside metabolism, and other pathways that are essential for biofilm initiation, maturation, and structural maintenance (Kirke et al., 2004; Mao et al., 2020; Silva et al., 2015). Their decreased expression directly contributes to defective biofilm formation. Meanwhile, reduced flagellar density and altered membrane structure in the mutant further hinder biofilm development, as both motility and membrane integrity are essential for initial surface attachment and biofilm architecture. Decreased biofilm formation is also associated with increased antibiotic susceptibility, such as elevated neomycin sensitivity (Zhang and Lu, 2003), consistent with the antibiotic susceptibility results. These results confirm the conserved regulation of biofilm formation by feoB within the genus Aeromonas, and targeting feoB could retain biofilm formation and improve antimicrobial efficacy against A. hydrophila.
In numerous bacterial species, feoB deletion reduces colonization capacity or attenuate virulence (Fetherston et al., 2012; Huang et al., 2023; Runci et al., 2019; Sabri et al., 2008; Stojiljkovic et al., 1993; Tsolis et al., 1996; Velayudhan et al., 2000; Wyckoff et al., 2006). However, our study revealed comparable LD50 values between the AhΔfeoB and WT in the BALB/c mouse infection model. These results demonstrated that feoB deletion did not significantly weaken the virulence of A. hydrophila. Multiple compensatory mechanisms account for the unchanged virulence of AhΔfeoB. Despite defective biofilm formation and abnormal membrane structure, hemolytic activity and swarming motility (two virulence factors associated with host cell damage and tissue invasion) remained unaltered. Moreover, DIA-based proteomics identified several activated pathogenic pathways including flagellar assembly and quorum sensing, which represent a compensatory molecular upregulation triggered by genetic deficiency. Pathway enrichment at the proteome level reflects molecular transcriptional/translational adaptive responses, rather than directly equating to final phenotypic performance. Although related pathway proteins were enriched, the compensatory upregulation was insufficient to restore the actual physiological functions. Multiple downstream functional cascades and post-translational modifications may still be impaired, ultimately leading to the reduced swimming motility and biofilm formation phenotypes we observed. As reported, under iron-limitation, A. hydrophila upregulates multiple virulence-related traits, including protease, hemolysin, and lipase activities as well as motility, ultimately increasing host mortality (Teng et al., 2018). These findings demonstrate that virulence of A. hydrophila is controlled by a sophisticated coordinated regulatory network. Accordingly, single deletion of feoB is insufficient to markedly attenuate its pathogenicity, suggesting therapies targeting feoB should be combined with other virulence-related targets to achieve better control of infection (Feng et al., 2016; Raphael and Joens, 2003).
Iron is indispensable for diverse bacterial cellular processes, functioning as heme or iron-sulfur cluster cofactors in proteins involved in electron transport, oxidative stress sensing, and energy production (Lau et al., 2016). In this study, DIA-based proteomics uncovered the global regulatory effects of feoB on the proteome of A. hydrophila. GO and KEGG functional enrichment analyses showed that upregulated proteins were mainly enriched in amino acid catabolic pathways and secondary metabolite biosynthesis, whereas downregulated proteins were primarily related to metal ion (especially iron) transport, and membrane-related functions. These patterns resemble adaptive responses to iron starvation in Pseudomonas aeruginosa. Iron-limited proteomic studies in P. aeruginosa showed enhanced amino acid catabolism, remodeled energy metabolism via iron-independent entry of carbon into the tricarboxylic acid (TCA) cycle, increased abundance of twitching motility-related proteins, and repressed amino acid biosynthesis (Nelson et al., 2019). Upregulated amino acid catabolism in AhΔfeoB represents an adaptive strategy to generate energy and metabolic intermediates under disrupted iron homeostasis. The reduced ion transport proteins directly reflects impaired feoB-mediated iron uptake, and decreased membrane-associated proteins match the structural defects of AhΔfeoB.
GSEA further indicated the metabolic reprogramming prioritizes essential biosynthesis and regulatory pathways while downregulating energy-intensive central carbon metabolism, allowing A. hydrophila to maintain basic growth and environmental adaptability with defective ferrous iron uptake. A similar regulatory pattern has been reported in iron-limited A. hydrophila NJ-35. GO analysis revealed tight regulation of metabolism, biosynthesis, transmembrane transport, redox homeostasis and quorum sensing, while KEGG analysis showed upregulated quorum sensing and downregulated carbon metabolism pathways (Hood and Skaar, 2012).
Conclusion
This study systematically characterizes biological functions of the ferrous iron transporter FeoB in Aeromonas hydrophila ATCC 7966. The results indicated that feoB is critical for maintaining membrane integrity, modulating stress responses, altering antibiotic susceptibility, regulating biofilm development, and remodeling global protein expression patterns. Deletion of feoB causes prominent morphological changes, enhanced sensitivity to oxidative stress and membrane-damaging agents, inhibited biofilm formation and downregulated multiple biofilm-associated genes. Despite its central role in iron transport, feoB deletion neither impair bacterial growth under iron limitation nor attenuates virulence in the BALB/c mouse model. Proteomic data revealed extensive metabolic reprogramming after feoB deletion, including enhanced amino acid catabolism and repressed metal-ion transport and membrane-related processes, further highlighting the central role of feoB in coordinating iron homeostasis and bacterial environmental adaptation.
These results deepen our understanding of the interplay between iron uptake and environmental adaptation in A. hydrophila and identify feoB as a potential antimicrobial target. Nevertheless, bacterial growth and pathogenicity remained unimpaired. This indicates that targeting feoB alone cannot achieve optimal therapeutic efficacy; combinatorial strategies against multiple regulatory pathways are therefore required to realize effective antibacterial outcomes.
Acknowledgments
Financial support for this study was provided by several funding bodies, including the Natural Science Foundation of Hebei Province (Grant No. C2019205044), the Hebei Provincial Higher Education Science and Technology Research Project (ZD2018070), and the Outstanding Youth Fund Project of the Hebei Provincial Department of Education (YQ2014026). Additional support was received from the Key Fund Project of Hebei Normal University (L2016Z03) as well as the Graduate Innovation Research Program of Hebei Normal University (XCXZZBS202653).
Conflict of Interest
The authors confirm that no financial, commercial, or personal affiliations exist that could have inappropriately influenced the findings of this study.
Ethical Statements
All experimental animal procedures were carried out according to recommendations in the Guide for the Care and Use of Laboratory Animals of Hebei Province, China. The animal experiment protocol was approved by the animal monitoring committee of Hebei Normal University and IACUC approval number is LLSC2025091. All efforts were made to minimize suffering.
Supplementary Information
The online version contains supplementary material available at https://doi.org/10.71150/jm.2605004
Fig. S5.
Cluster analysis of DEPs. C1-C10: The left side shows a line plot of the expression trend of DEGs in each cluster of the all samples. The left side of the rectangle shows the serial number of clusters, and the number of genes within each cluster (cluster size) is shown below the line plot. In the middle is a heat map of the clusters of DEGs in the WT and feoB samples. The right side shows the pathways that were significantly enriched for DEGs in each cluster after GO enrichment analysis.
jm-2605004-Supplementary-Fig-S5.pdf
Fig. 1.
feoB gene expression, hemolytic activity and motility assay of WT, AhΔfeoB and CΔfeoB. (A) Transcript level of feoB, (B) hemolytic activity, and (C) motility.
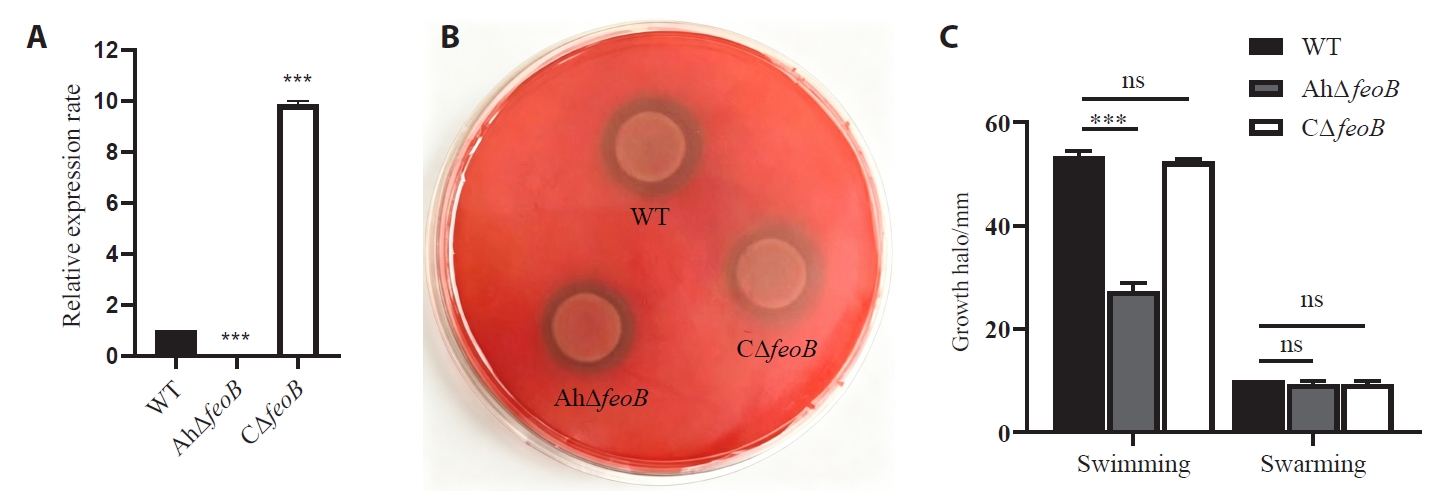
Fig. 2.Growth characteristics of WT and AhΔfeoB and CΔfeoB. (A, B) Growth curves in LB with or without 2,2'-dipyridyl (DIP). (C, D) Growth curve in M9 with or without 0.2 mM FeSO4 supplementation.
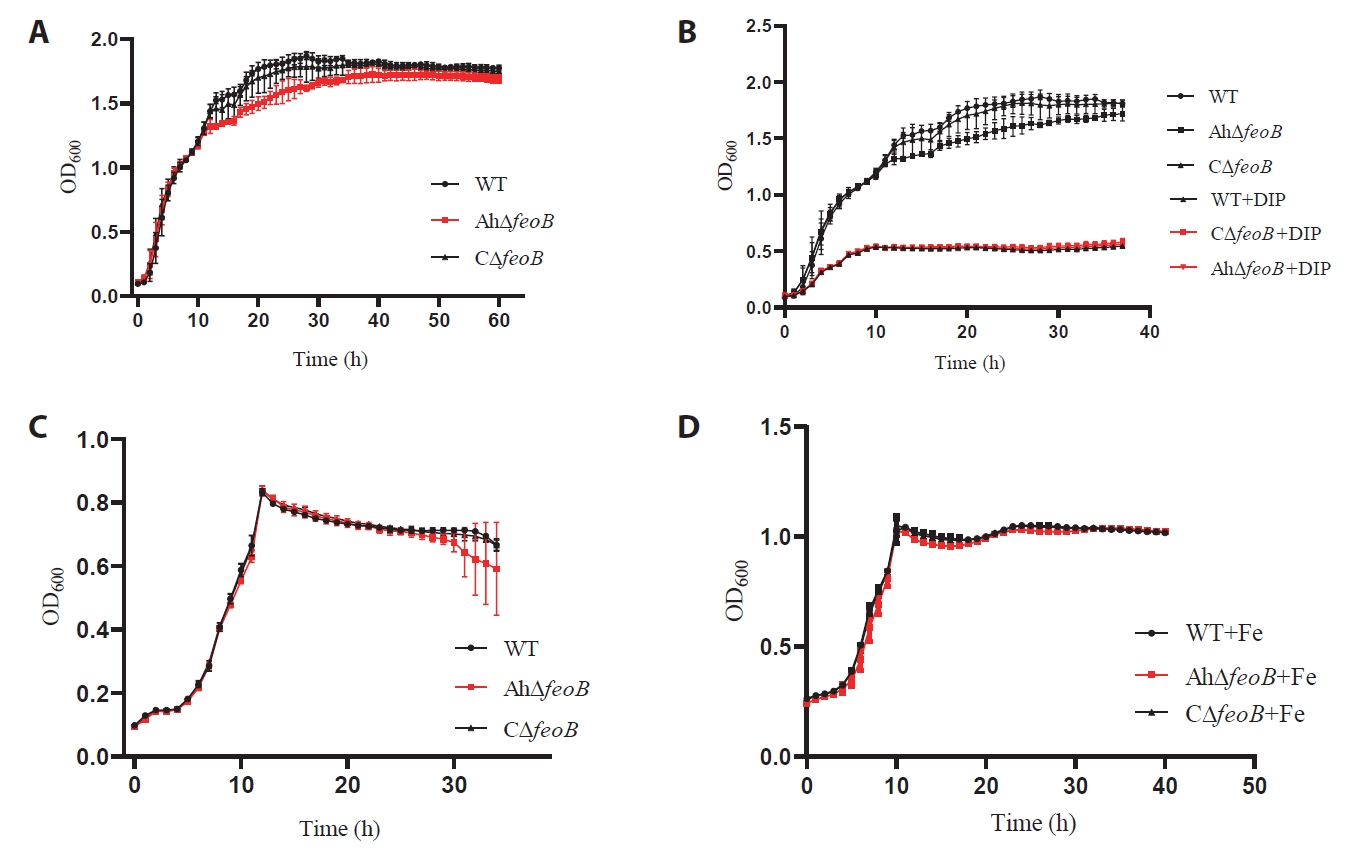
Fig. 3.Kinetics of Fe2+ uptake in WT and AhΔfeoB. Cellular Fe2+ uptake was measured over 35 min incubation and fitted with the Michaelis‑Menten model. Kinetic parameters (R2, Vmax, and Km) values are shown for each strain.
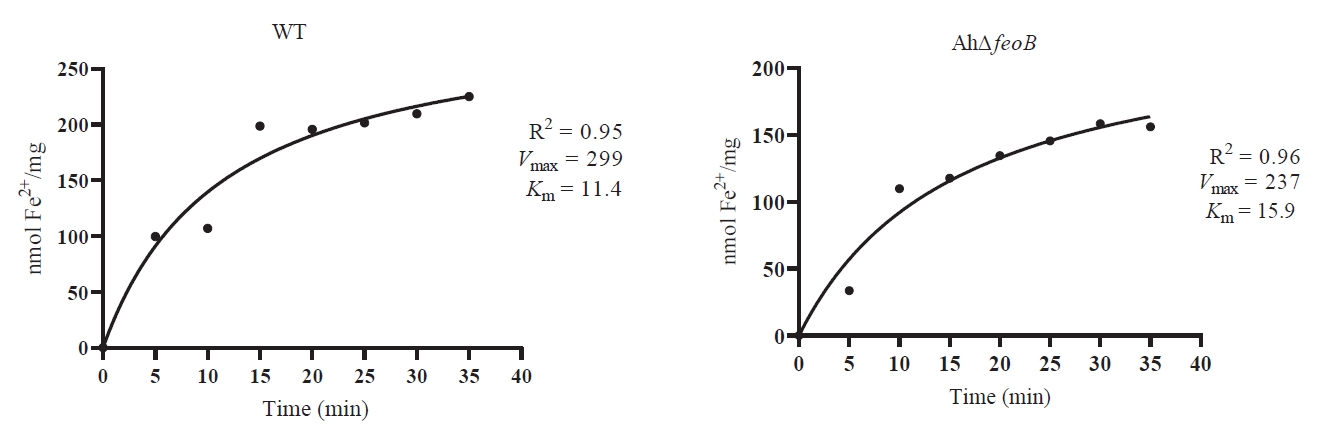
Fig. 4.Intracellular ferrous ion levels, stress tolerance and MIC of clindamycin against WT and AhΔfeoB. (A) Intracellular ferrous ion levels. (B) Oxidative stress sensitivity. (C) Survival rates under 0.5% sodium deoxycholate treatment. (D) MIC determination of clindamycin with or without DIP exposure.
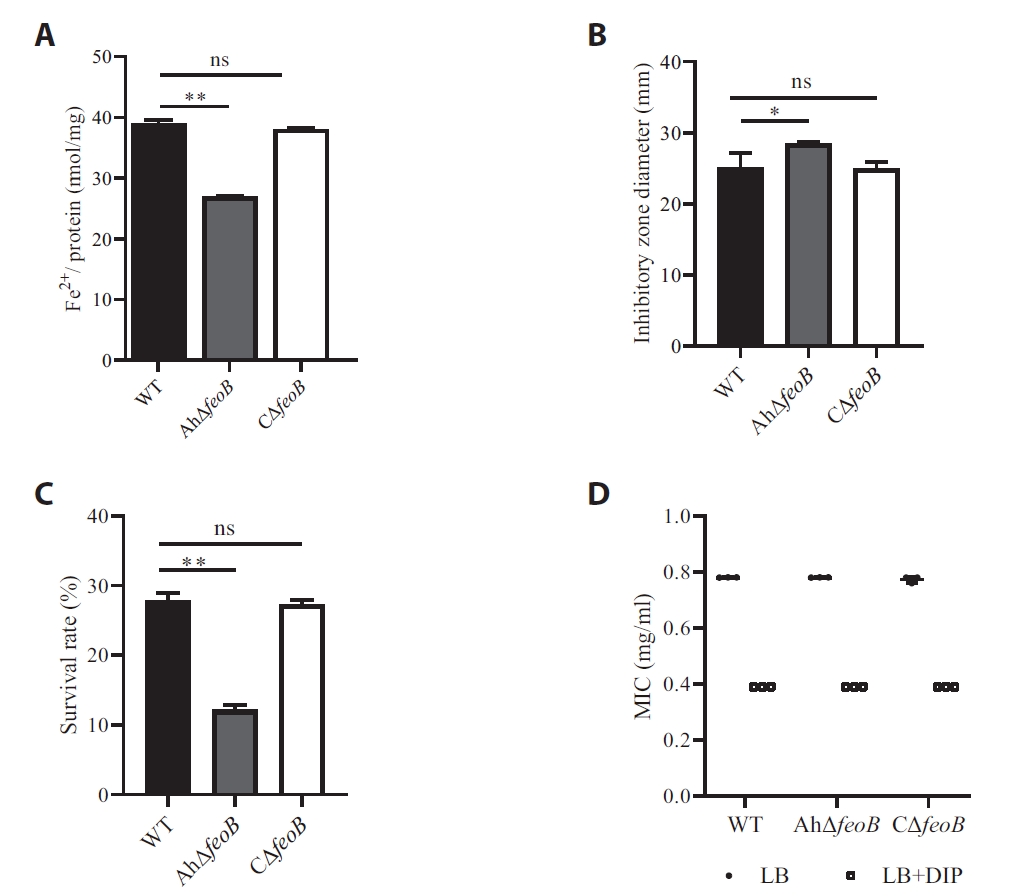
Fig. 5.Biofilm formation of WT and AhΔfeoB and CΔfeoB. (A) Quantitative biofilm formation capacity. (B) Biofilm-associated genes mRNA expression level. (C) Acridine orange-stained fluorescence microscopy images. Data are presented as Mean ± SD. *P < 0.05, **P < 0.01, ***P < 0.001; ns, not significant; SD, standard deviation.
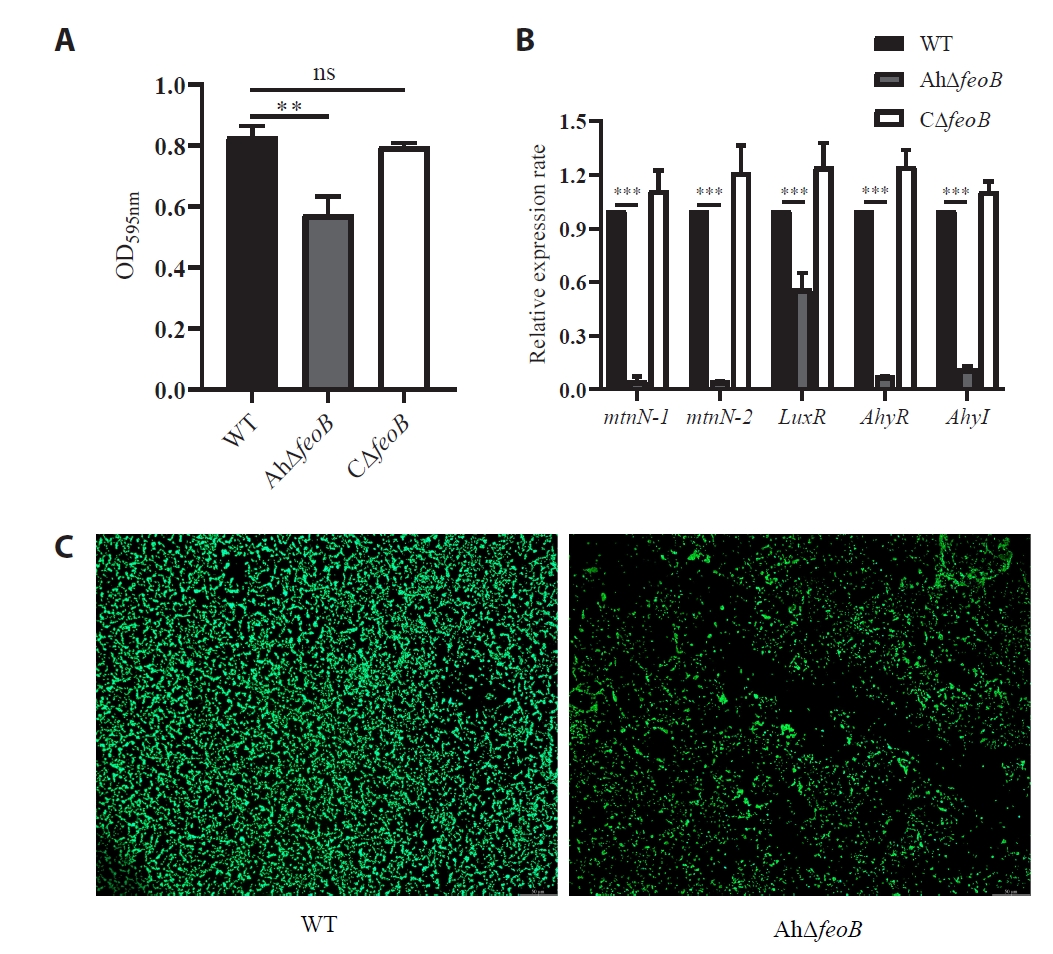
Fig. 6.Transmission electron microscopy (TEM) observation of WT and AhΔfeoB and CΔfeoB.
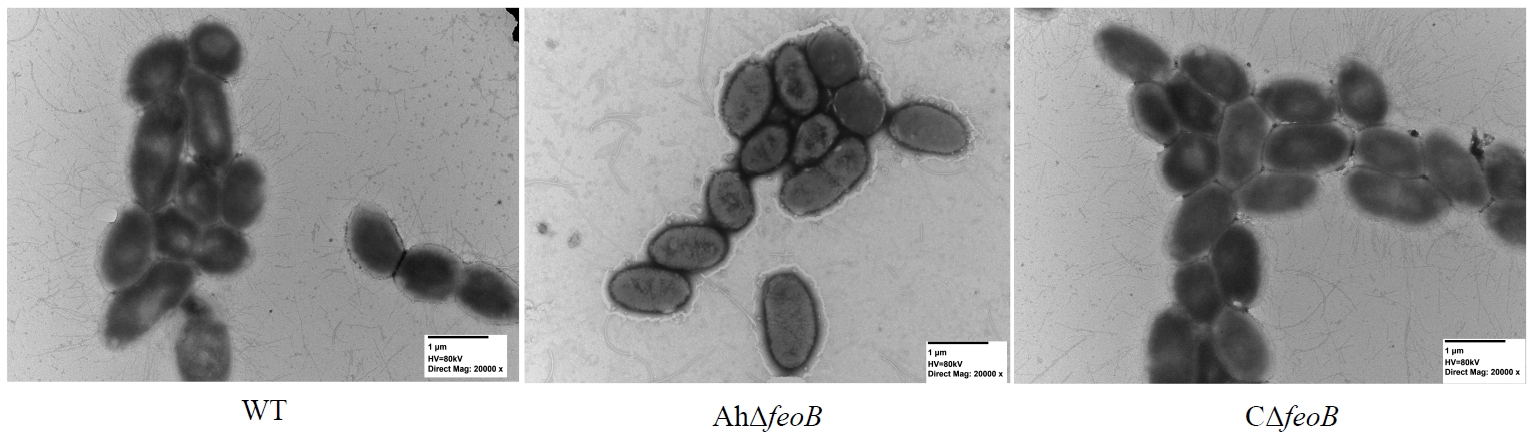
Fig. 7.Expression levels of virulence-related genes and dose-dependent survival curves of BALB/c mice. (A) Transcript levels of virulence genes between WT and AhΔfeoB and CΔfeoB. (B) Dose-dependent survival curves of BALB/c mice infected with different doses of WT and AhΔfeoB cells. 50% Lethal dose (LD50) and R2 values are indicated. *P < 0.05; **P < 0.01; ***P < 0.001. ns, not significant.
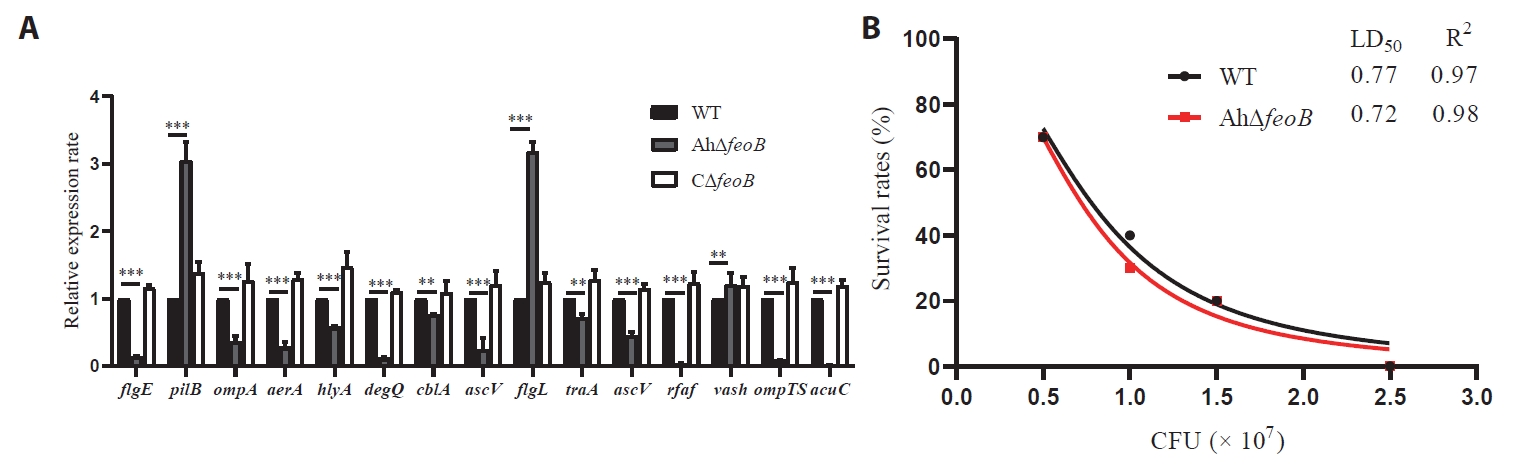
Fig. 8.DIA-based quantitative proteomic analysis. (A) Proteins correlation analysis of three biological replicates. (B) PCA showing proteomic variations between experimental groups. (C) Volcano plot of proteins exhibiting significant differential expression (DEPs, fold change > 1, P < 0.05). Blue, downregulated proteins; red, upregulated proteins; gray, non-significant proteins.
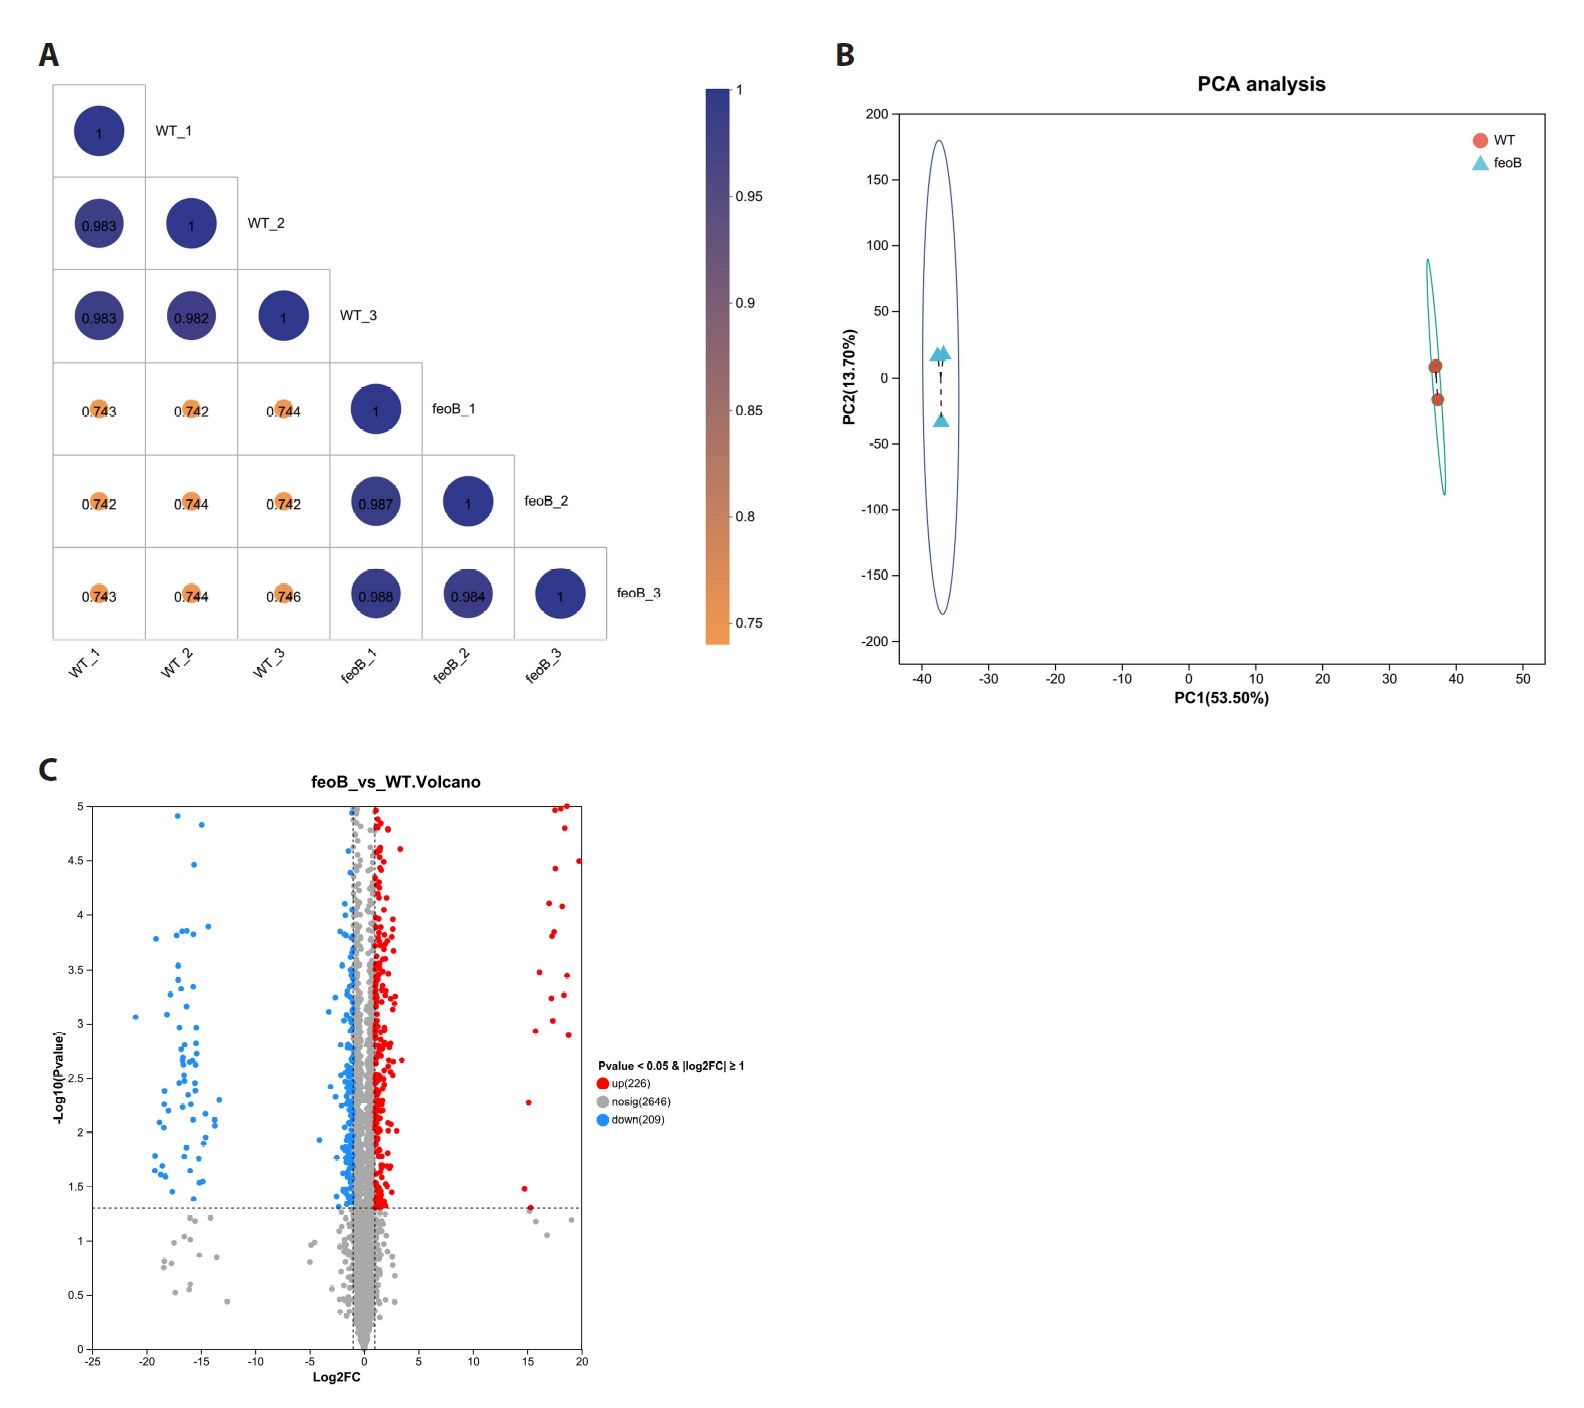
Fig. 9.GO and KEGG enrichment bubble plots of DEPs. (A) GO enrichment of upregulated genes; (B) KEGG enrichment of upregulated genes; (C) GO enrichment of downregulated genes; (D) KEGG enrichment of downregulated genes. Bubble color corresponds to P value, bubble size reflects the count of enriched proteins, and the horizontal axis shows the Rich factor.
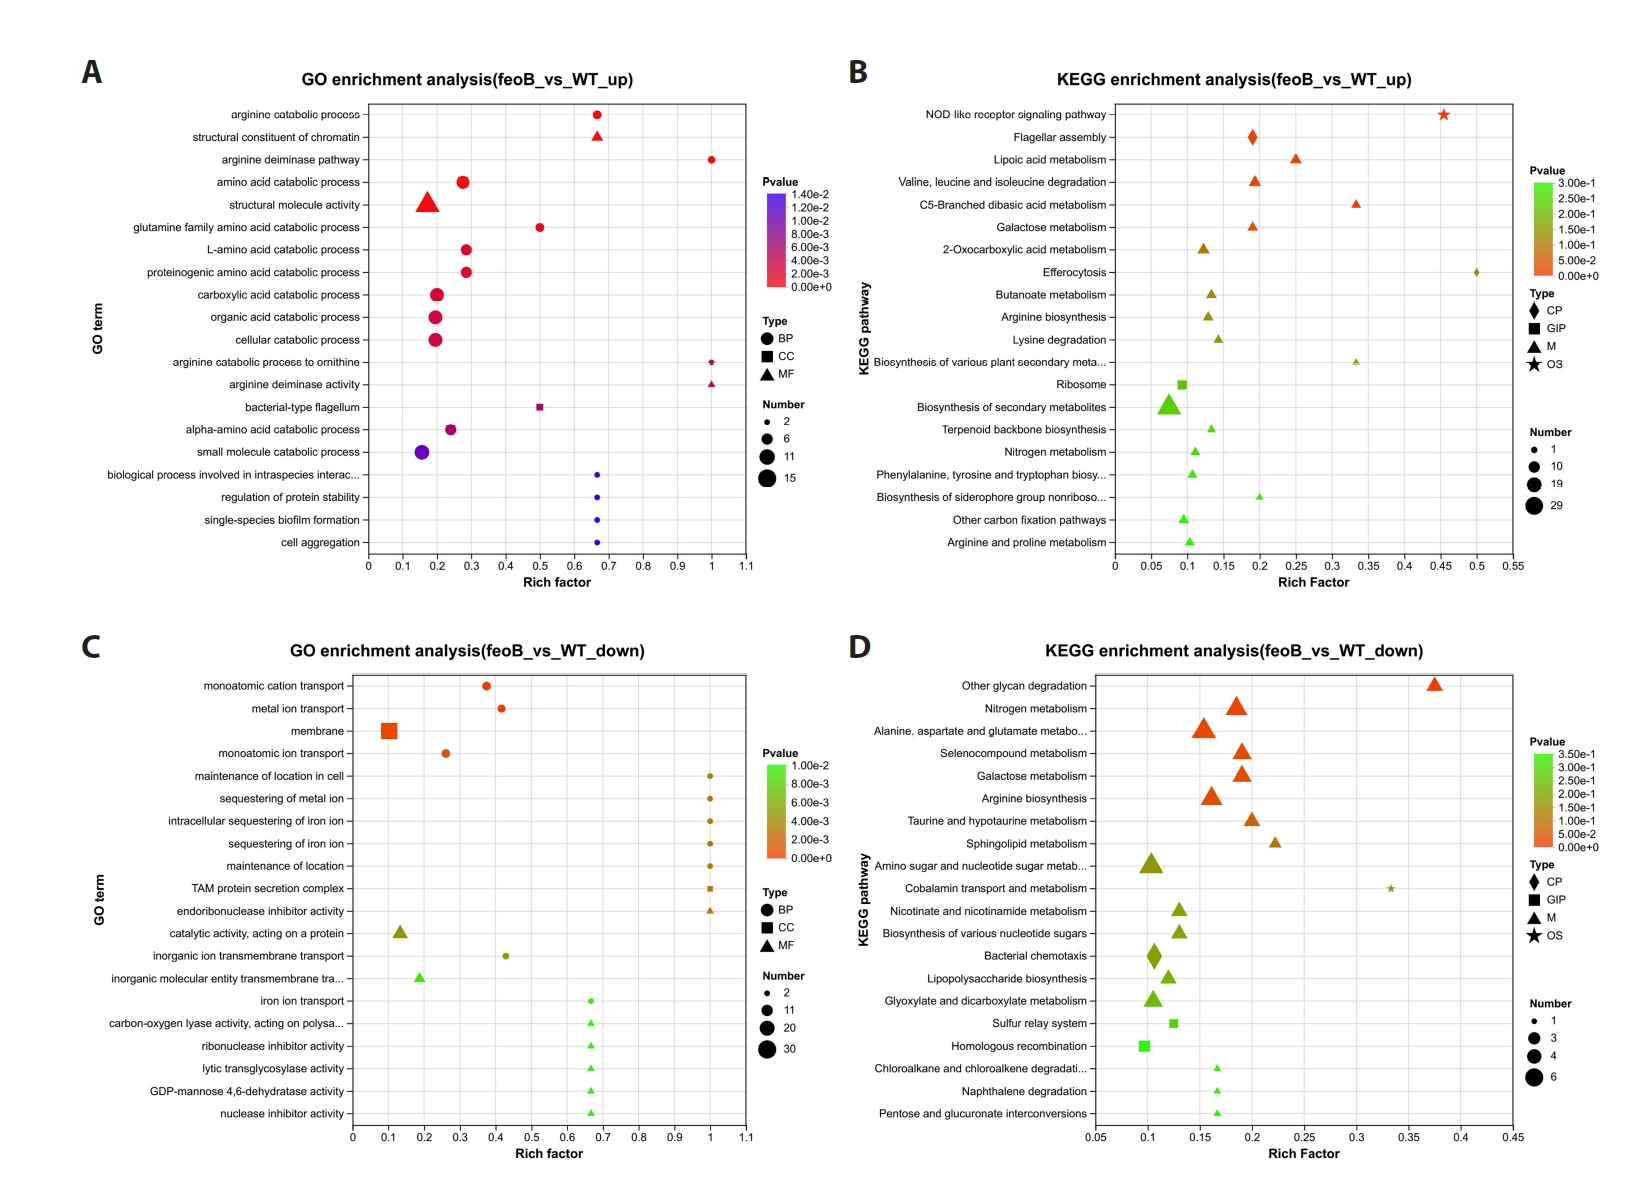
Fig. 10.Circular enrichment analysis and GSEA analysis. (A) Circular enrichment analysis of DEPs. The four concentric layers represent the functional classification and DEP number (outermost), background protein quantity and enrichment significance (color gradient indicates P-value, redder color means more significant), the ratio of upregulated (red) and downregulated (blue) proteins, and the Rich Factor reflecting pathway enrichment degree (innermost). (B) GSEA analysis of DEPs.
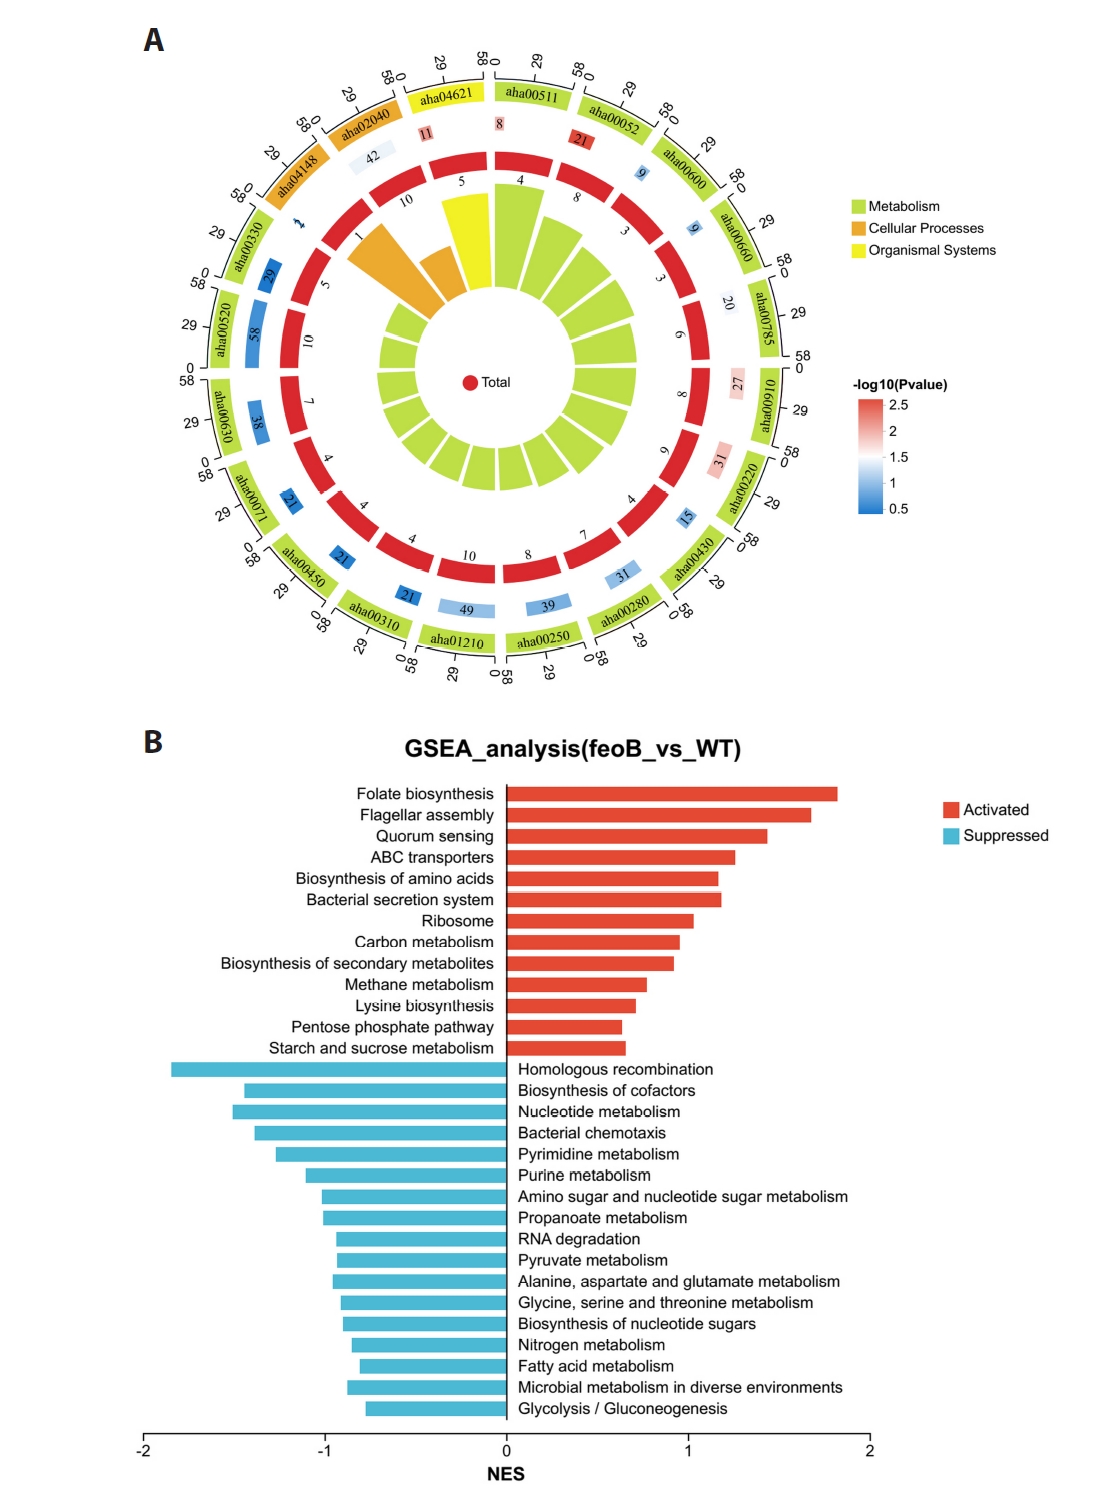
Table 1.Strains and plasmids
|
Strains |
Description |
Source |
|
Aeromonas hydrophila ATCC 7966 |
Wild-type strain |
Laboratory preservation |
|
Escherichia coli DH5α |
F− Ф80lacZΔM15 Δ(lacZYA-argF) U169 recA1 endA1hsdR17 phoA supE44 λ-thi-1 gyrA96 relA1 |
Laboratory preservation |
|
Escherichia coli S17-λpir |
RP4-2(Km::Tn7,Tc::Mu-1), pro-82, LAMpir, recA1, endA1, thiE1, hsdR17, creC510 |
Laboratory preservation |
|
AhΔfeoB
|
A. hydrophila ATCC 7966, in-frame deletion of feoB
|
This study |
|
CΔfeoB
|
AhΔfeoB complemented with intact feoB gene |
This study |
|
Plasmids
|
Description
|
Source
|
|
pRE112 |
pGP704 suicide plasmid, pir dependent, oriT, oriV, sacB, Cmr
|
Laboratory preservation |
|
pBBR1MCS1 |
Broad-host-range plasmid, Cmr
|
Laboratory preservation |
|
pAR1 |
pRE112 harboring 446 bp upstream gene and 568 bp downstream gene of feoB (in-frame deletion), Cmr
|
This study |
|
pBR-feoB
|
pBBR1-MCS1 derivative containing full fragment of feoB with its putative promoter and ORF, Cmr
|
This study |
Table 2.Result of antibiotic susceptibility testing by K-B disk diffusion method
|
Antibiotic agent |
Antibiotic class |
Drug content (μg/tablet) |
R/mm |
I/mm |
S/mm |
Inhibition zone diameter (mm)/sensitivity |
|
WT |
AhΔfeoB
|
|
β-Lactams |
Cefazolin |
30 |
≤ 14 |
15–17 |
≥ 18 |
0/R |
0/R |
|
Penicillin |
10 |
≤ 14 |
15–19 |
≥ 20 |
0/R |
0/R |
|
Ampicillin |
10 |
≤ 17 |
18–20 |
≥ 21 |
0/R |
0/R |
|
Coumarins |
Novobiocin |
30 |
≤ 12 |
13–16 |
≥ 17 |
8/R |
10/R |
|
Sulfonamides |
Trimethoprim-Sulfamethoxazole (SMX-TMP) |
25 |
≤ 10 |
11–15 |
≥ 16 |
17/S |
19/S |
|
Macrolides |
Acetylspiramycin |
30 |
≤ 13 |
14–17 |
≥ 18 |
0/R |
0/R |
|
Polypeptides |
Vancomycin |
30 |
≤ 14 |
15–16 |
≥ 17 |
0/R |
0/R |
|
Teicoplanin |
30 |
≤ 10 |
11–13 |
≥ 14 |
0/R |
0/R |
|
Polymyxin B |
300 units |
≤ 8 |
9–12 |
≥ 12 |
13/S |
12/S |
|
Aminoglycosides |
Streptomycin
|
10 |
≤ 11 |
12–14 |
≥ 15 |
9/R |
12/I |
|
Gentamicin
|
10 |
≤ 12 |
13–14 |
≥ 15 |
11/R |
15/S |
|
Amikacin |
30 |
≤ 14 |
15–16 |
≥ 17 |
16/I |
15/I |
|
Neomycin
|
30 |
≤ 12 |
13–16 |
≥ 17 |
11/R |
13/I |
|
Quinolones |
Ofloxacin |
5 |
≤ 12 |
13–15 |
≥ 16 |
22/S |
22/S |
|
Norfloxacin |
30 |
≤ 12 |
13–16 |
≥ 17 |
20/S |
23/S |
|
Levofloxacin |
5 |
≤ 13 |
14–16 |
≥ 17 |
19/S |
25/S |
|
Enrofloxacin
|
5 |
≤ 16 |
17–22 |
≥ 23 |
22/I |
24/S |
|
Lincosamides |
Clindamycin |
2 |
≤ 14 |
15–18 |
≥ 19 |
0/R |
15/R |
|
Erythromycin |
15 |
≤ 13 |
14–22 |
≥ 23 |
10/R |
9/R |
|
Tetracyclines |
Tetracycline |
30 |
≤ 11 |
12–22 |
≥ 23 |
17/I |
20/I |
|
Florfenicol |
30 |
≤ 12 |
13–17 |
≥ 18 |
23/S |
26/S |
|
Minocycline |
30 |
≤ 12 |
13–22 |
≥ 23 |
15/I |
17/I |
|
Doxycycline |
30 |
≤ 10 |
11–15 |
≥ 16 |
21/S |
19/S |
|
Lincosamides |
Lincomycin |
2 |
≤ 14 |
15–20 |
≥ 21 |
0/R |
0/R |
|
Carbapenems |
Meropenem |
10 |
≤ 19 |
20–22 |
≥ 23 |
21/I |
19/R |
References
- Agwunobi DO, Li M, Wang N, Chang G, Zhang X, et al. 2022. Proteomic analysis suggests that monoterpenes in lemongrass disrupt Ca2+ homeostasis in Haemaphysalis longicornis leading to mitochondrial depolarization and cytotoxicity. Proteomics. 22: e2100156. ArticlePubMedLink
- Brown AN, Anderson MT, Smith SN, Bachman MA, Mobley HLT. 2023. Conserved metabolic regulator ArcA responds to oxygen availability, iron limitation, and cell envelope perturbations during bacteremia. mBio. 14: e01448-23.ArticlePubMedPMCLink
- Bustin SA, Benes V, Garson JA, Hellemans J, Huggett J, et al. 2009. The MIQE guidelines: Minimum information for publication of quantitative real-time PCR experiments. Clin Chem. 55: 611–622. ArticlePubMedPDF
- Chen L, Wang Y, Fan L, Yang N, Zeng J, et al. 2023. Response regulator KdpE contributes to Aeromonas dhakensis virulence. Aquaculture. 568: 739298.Article
- Chen T, Wang Y, Ren F, Li M, Zhang Z, et al. 2025. Biological functions of tolA in Aeromonas hydrophila. Acta Microbiol Sin. 65: 2111–2127. ArticlePubMedLink
- Chen F, Wen S, He X, Lei A, Huang T, et al. 2026. Integrated transcriptomic and proteomic analysis reveals the immune response of largemouth bass (Micropterus salmoides) to Aeromonas hydrophila infection. J Fish Dis. 49: e70165. Article
- Conway GE, He Z, Hutanu AL, Cribaro GP, Manaloto E, et al. 2019. Cold Atmospheric Plasma induces accumulation of lysosomes and caspase-independent cell death in U373MG glioblastoma multiforme cells. Sci Rep. 9: 12891.ArticlePubMedPMCPDF
- Feng Y, Liu M, Cheng A. 2016. Component and functional mechanism of the ferrous iron acquisition system in Gram-negative bacteria - A review. Acta Microbiol Sin. 56: 1061–1069. PubMed
- Fetherston JD, Mier I Jr, Truszczynska H, Perry RD. 2012. The Yfe and Feo transporters are involved in microaerobic growth and virulence of Yersinia pestis in bubonic plague. Infect Immun. 80: 3880–3891. ArticlePubMedPMCLink
- Gómez-Garzón C, Barrick JE, Payne SM. 2022. Disentangling the evolutionary history of Feo, the major ferrous iron transport system in bacteria. mBio. 13: e03512-21. ArticlePubMedPMC
- Gong J, Wang Y, Jiang Y, Zhang D, Cai Y, et al. 2024. Ferric uptake regulator (fur) affects the pathogenicity of Aeromonas veronii TH0426 by regulating flagellar assembly and biofilm formation. Aquaculture. 580: 740361.Article
- Guan Y, Liang S, Wang Y, Bai S, Huang C, et al. 2025. The ferrous iron transporter FeoB mediates motility, biofilm formation, and virulence in Aeromonas veronii. Microb Pathog. 208: 108014.ArticlePubMed
- Hood MI, Skaar EP. 2012. Nutritional immunity: Transition metals at the pathogen-host interface. Nat Rev Microbiol. 10: 525–537. ArticlePubMedPMCPDF
- Huang M, Wang M, Feng Y, Wang M, Gao Q, et al. 2023. Functional characterization of FeoAB in iron acquisition and pathogenicity in Riemerella anatipestifer. Microbiol Spectr. 11: e01373-23.ArticlePubMedLink
- Kammler M, Schon C, Hantke K. 1993. Characterization of the ferrous iron uptake system of Escherichia coli. J Bacteriol. 175: 6212–6219. ArticlePubMedPMCLink
- Kirke DF, Swift S, Lynch MJ, Williams P. 2004. The Aeromonas hydrophila LuxR homologue AhyR regulates the N-acyl homoserine lactone synthase, AhyI positively and negatively in a growth phase-dependent manner. FEMS Microbiol Lett. 241: 109–117. ArticlePubMed
- Lange MD, Abernathy J, Shoemaker CA, Zhang D, Kirby A, et al. 2020. Proteome analysis of virulent Aeromonas hydrophila reveals the upregulation of iron acquisition systems in the presence of a xenosiderophore. FEMS Microbiol Lett. 367: fnaa169.ArticlePubMedPDF
- Lau CKY, Krewulak KD, Vogel HJ. 2016. Bacterial ferrous iron transport: The Feo system. FEMS Microbiol Rev. 40: 273–298. ArticlePubMed
- Li Q, Li Z, Fei X, Tian Y, Zhou G, et al. 2022. The role of TolA, TolB, and TolR in cell morphology, OMVs production, and virulence of Salmonella Choleraesuis. AMB Express. 12: 5.ArticlePubMedPMCPDF
- Li M, Li D, Li F, Liu W, Wang S, et al. 2023a. Hemolysin from Aeromonas hydrophila enhances the host's serum enzyme activity and regulates transcriptional responses in the spleen of Cyprinus rubrofuscus. Ecotoxicol Environ Saf. 263: 115375.Article
- Li Z, Li W, Lu J, Liu Z, Lin X, et al. 2023b. Quantitative proteomics analysis reveals the effect of a MarR family transcriptional regulator AHA_2124 on Aeromonas hydrophila. Biology (Basel). 12: 1473.Article
- Liu T, Shang J, Chen Q. 2025a. Superoxide dismutases in immune regulation and infectious diseases. Antioxidants (Basel). 14: 809.Article
- Liu C, Shao J, Ma X, Tang Y, Li J, et al. 2025b. A novel two-component system contributing the catabolism of c-di-GMP influences virulence in Aeromonas veronii. Front Microbiol. 16: 1527317.Article
- Liu D, Zhang T, Wang Y, Muhammad M, Xue W, et al. 2019. Knockout of alanine racemase gene attenuates the pathogenicity of Aeromonas hydrophila. BMC Microbiol. 19: 72.ArticlePubMedPMCPDF
- Lopez AE, Grigoryeva LS, Barajas A, Cianciotto NP. 2023. Legionella pneumophila rhizoferrin promotes bacterial biofilm formation and growth within amoebae and macrophages. Infect Immun. 91: e00072-23.ArticlePubMedPMCLink
- Lo Sciuto A, Fernandez-Pinar R, Bertuccini L, Iosi F, Superti F, et al. 2014. The periplasmic protein TolB as a potential drug target in Pseudomonas aeruginosa. PLoS One. 9: e103784. ArticlePubMedPMC
- Mao L, Qin Y, Kang J, Wu B, Huang L, et al. 2020. Role of LuxR-type regulators in fish pathogenic Aeromonas hydrophila. J Fish Dis. 43: 215–225. ArticlePubMedLink
- Matuschek E, Ahman J, Webster C, Kahlmeter G. 2018. Antimicrobial susceptibility testing of colistin - Evaluation of seven commercial MIC products against standard broth microdilution for Escherichia coli, Klebsiella pneumoniae, Pseudomonas aeruginosa, and Acinetobacter spp. Clin Microbiol Infect. 24: 865–870. ArticlePubMed
- Muhammad M, Bai J, Alhassan AJ, Sule H, Ju J, et al. 2020. Significance of glutamate racemase for the viability and cell wall integrity of Streptococcus iniae. Biochemistry (Mosc). 85: 248–256. ArticlePubMedPDF
- Naikare H, Palyada K, Panciera R, Marlow D, Stintzi A. 2006. Major role for FeoB in Campylobacter jejuni ferrous iron acquisition, gut colonization, and intracellular survival. Infect Immun. 74: 5433–5444. ArticlePubMedPMCLink
- Nandi A, Yan LJ, Jana CK, Das N. 2019. Role of catalase in oxidative stress- and age-associated degenerative diseases. Oxid Med Cell Longev. 2019: 9613090.ArticlePubMedPMCPDF
- Nelson CE, Huang W, Brewer LK, Nguyen AT, Kane MA, et al. 2019. Proteomic analysis of the Pseudomonas aeruginosa iron starvation response reveals PrrF small regulatory RNA-dependent iron regulation of twitching motility, amino acid metabolism, and zinc homeostasis proteins. J Bacteriol. 201: e00754-18.ArticlePubMedPMCLink
- Oliveira F, Rohde H, Vilanova M, Cerca N. 2021. The emerging role of iron acquisition in biofilm-associated infections. Trends Microbiol. 29: 772–775. ArticlePubMed
- Pan Z, Guo J, Zhong Y, Fan L, Su Y. 2023. Gentamicin resistance to Escherichia coli related to fatty acid metabolism based on transcriptome analysis. Can J Microbiol. 69: 328–338. ArticlePubMed
- Ran C, Qin C, Xie M, Zhang J, Li J, et al. 2018. Aeromonas veronii and aerolysin are important for the pathogenesis of motile aeromonad septicemia in cyprinid fish. Environ Microbiol. 20: 3442–3456. ArticlePubMedLink
- Raphael BH, Joens LA. 2003. FeoB is not required for ferrous iron uptake in Campylobacter jejuni. Can J Microbiol. 49: 727–731. ArticlePubMed
- Reddy PJ, Sun Z, Wippel HH, Baxter DH, Swearingen K, et al. 2024. Borrelia PeptideAtlas: A proteome resource of common Borrelia burgdorferi isolates for Lyme research. Sci Data. 11: 1313.ArticlePubMedPMCPDF
- Runci F, Gentile V, Frangipani E, Rampioni G, Leoni L, et al. 2019. Contribution of active iron uptake to Acinetobacter baumannii pathogenicity. Infect Immun. 87: e00755-18.ArticlePubMedPMCLink
- Sabri M, Caza M, Proulx J, Lymberopoulos MH, Bree A, et al. 2008. Contribution of the SitABCD, MntH, and FeoB metal transporters to the virulence of avian pathogenic Escherichia coli O78 strain χ7122. Infect Immun. 76: 601–611. ArticlePubMedLink
- Seike S, Kobayashi H, Ueda M, Takahashi E, Okamoto K, et al. 2021. Outer membrane vesicles released from Aeromonas strains are involved in the biofilm formation. Front Microbiol. 11: 613650.ArticlePubMedPMC
- Shadangi S, Singh A, Rana S. 2025. Deciphering the mechanism of action of a short, synthetic designer AMP against Gram-negative bacteria. Biopolymers. 116: e70019. ArticlePubMed
- Shin M, Park J, Jin Y, Kim IJ, Payne SM, et al. 2020. Biochemical characterization of bacterial FeoBs: A perspective on nucleotide specificity. Arch Biochem Biophys. 685: 108350.ArticlePubMedPMC
- Silva AJ, Parker WB, Allan PW, Ayala JC, Benitez JA. 2015. Role of methylthioadenosine/S-adenosylhomocysteine nucleosidase in Vibrio cholerae cellular communication and biofilm development. Biochem Biophys Res Commun. 461: 65–69. ArticlePubMedPMC
- Stojiljkovic I, Cobeljic M, Hantke K. 1993. Escherichia coli K-12 ferrous iron uptake mutants are impaired in their ability to colonize the mouse intestine. FEMS Microbiol Lett. 108: 111–115. ArticlePubMed
- Strzelecki P, Nowicki D. 2025. Tools to study microbial iron homeostasis and oxidative stress: Current techniques and methodological gaps. Front Mol Biosci. 12: 1628725.ArticlePubMedPMC
- Teng T, Xi B, Chen K, Pan L, Xie J, et al. 2018. Comparative transcriptomic and proteomic analyses revealed upregulated expression of virulence and iron transport factors of Aeromonas hydrophila under iron limitation. BMC Microbiol. 18: 52.ArticlePubMedPMC
- Tsolis RM, Baumler AJ, Heffron F, Stojiljkovic I. 1996. Contribution of TonB- and Feo-mediated iron uptake to growth of Salmonella typhimurium in the mouse. Infect Immun. 64: 4549–4556. ArticlePubMedPMCLink
- Velayudhan J, Hughes NJ, McColm AA, Bagshaw J, Clayton CL, et al. 2000. Iron acquisition and virulence in Helicobacter pylori: A major role for FeoB, a high-affinity ferrous iron transporter. Mol Microbiol. 37: 274–286. ArticlePubMed
- Wainwright M. 1991. Streptomycin: Discovery and resultant controversy. Hist Philos Life Sci. 13: 97–124. PubMed
- Wang N, Wang H, Ji A, Li N, Chang G, et al. 2022. Proteomic changes in various organs of Haemaphysalis longicornis under long-term starvation. PLoS Negl Trop Dis. 16: e0010692. ArticlePubMedPMC
- Wang G, Wang Y, Zhang L, Cai Q, Lin Y, et al. 2020. Proteomics analysis reveals the effect of Aeromonas hydrophila sirtuin CobB on biological functions. J Proteomics. 225: 103848.ArticlePubMed
- Wang Z, Yu H, Ma L. 2021. Construction and phenotypic study of Pseudomonas aeruginosa inducibly expressing a ferric uptake regulator. Sheng Wu Gong Cheng Xue Bao. 37: 3253–3267. ArticlePubMed
- Wyckoff EE, Mey AR, Leimbach A, Fisher CF, Payne SM. 2006. Characterization of ferric and ferrous iron transport systems in Vibrio cholerae. J Bacteriol. 188: 6515–6523. ArticlePubMedPMCLink
- Xie F, Wang J, Zhang B. 2023. RefFinder: A web-based tool for comprehensively analyzing and identifying reference genes. Funct Integr Genomics. 23: 125.ArticlePubMedPDF
- Zdanowicz M, Mudryk ZJ, Perlinski P. 2020. Abundance and antibiotic resistance of Aeromonas isolated from the water of three carp ponds. Vet Res Commun. 44: 9–18. ArticlePubMedPMCPDF
- Zhang J, Lu C. 2003. Effects of Aeromonas hydrophila biofilm on the drug resistance. Acta Microbiol Sin. 43: 498–502. PubMed
- Zhang X, Wang Y, Wu Y, Yuan ZH, Cai Z, et al. 2022. Dual regulatory role exerted by cyclic dimeric GMP to control FsnR-mediated bacterial swimming. mBio. 13: e01414-22.ArticlePubMedPMCLink
- Zhang S, Yang W, Xie Y, Zhao X, Chen H, et al. 2024. Quantitative proteomics investigating the intrinsic adaptation mechanism of Aeromonas hydrophila to streptomycin. Proteomics. 24: e2300383. ArticlePubMed
- Zhao Y, Liu Y, Li N, Muhammad M, Gong S, et al. 2022. Significance of broad-spectrum racemases for the viability and pathogenicity of Aeromonas hydrophila. Future Microbiol. 17: 251–265. ArticlePubMed
- Zhu F, Yang Z, Zhang Y, Hu K, Fang W. 2017. Transcriptome differences between enrofloxacin-resistant and enrofloxacin-susceptible strains of Aeromonas hydrophila. PLoS One. 12: e0179549. ArticlePubMedPMC
Citations
Citations to this article as recorded by

 MSK


 , Dong Liu1,*


 ePub Link
 Cite this Article
 XML Download